


Cases
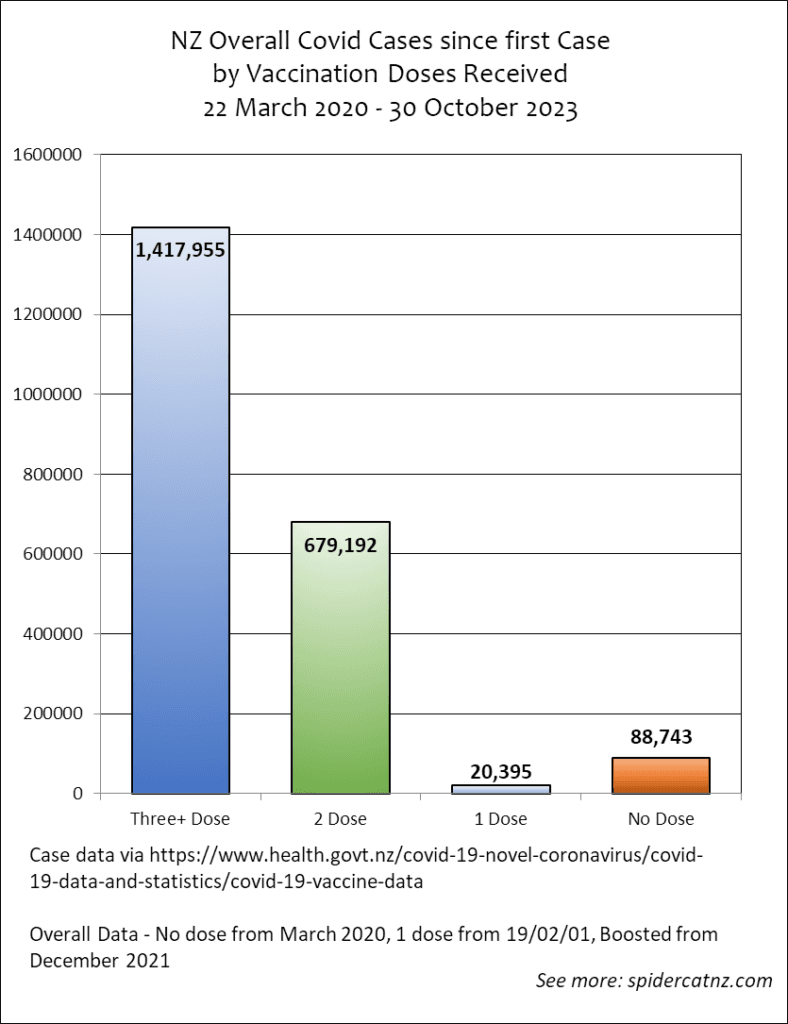
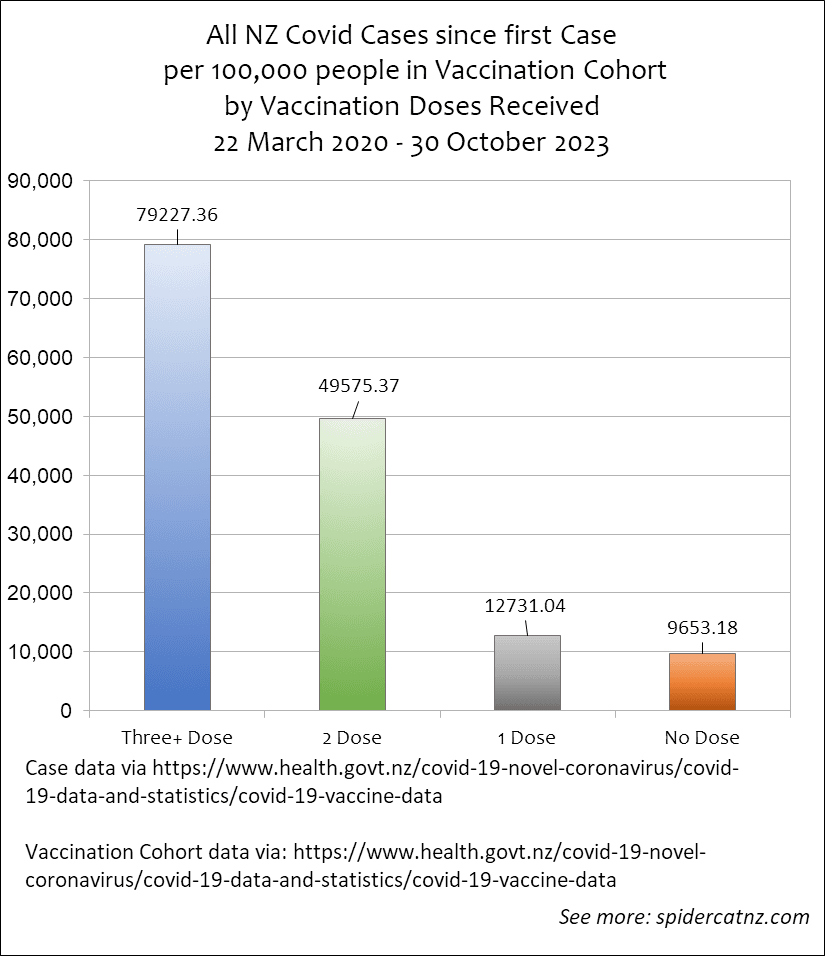
Overall Cases since First Recorded Case
For the No Dose group, the first case is from March 2020. 40+ months.
For the Boosted Group, the first case is from December 2021. 20+ months.
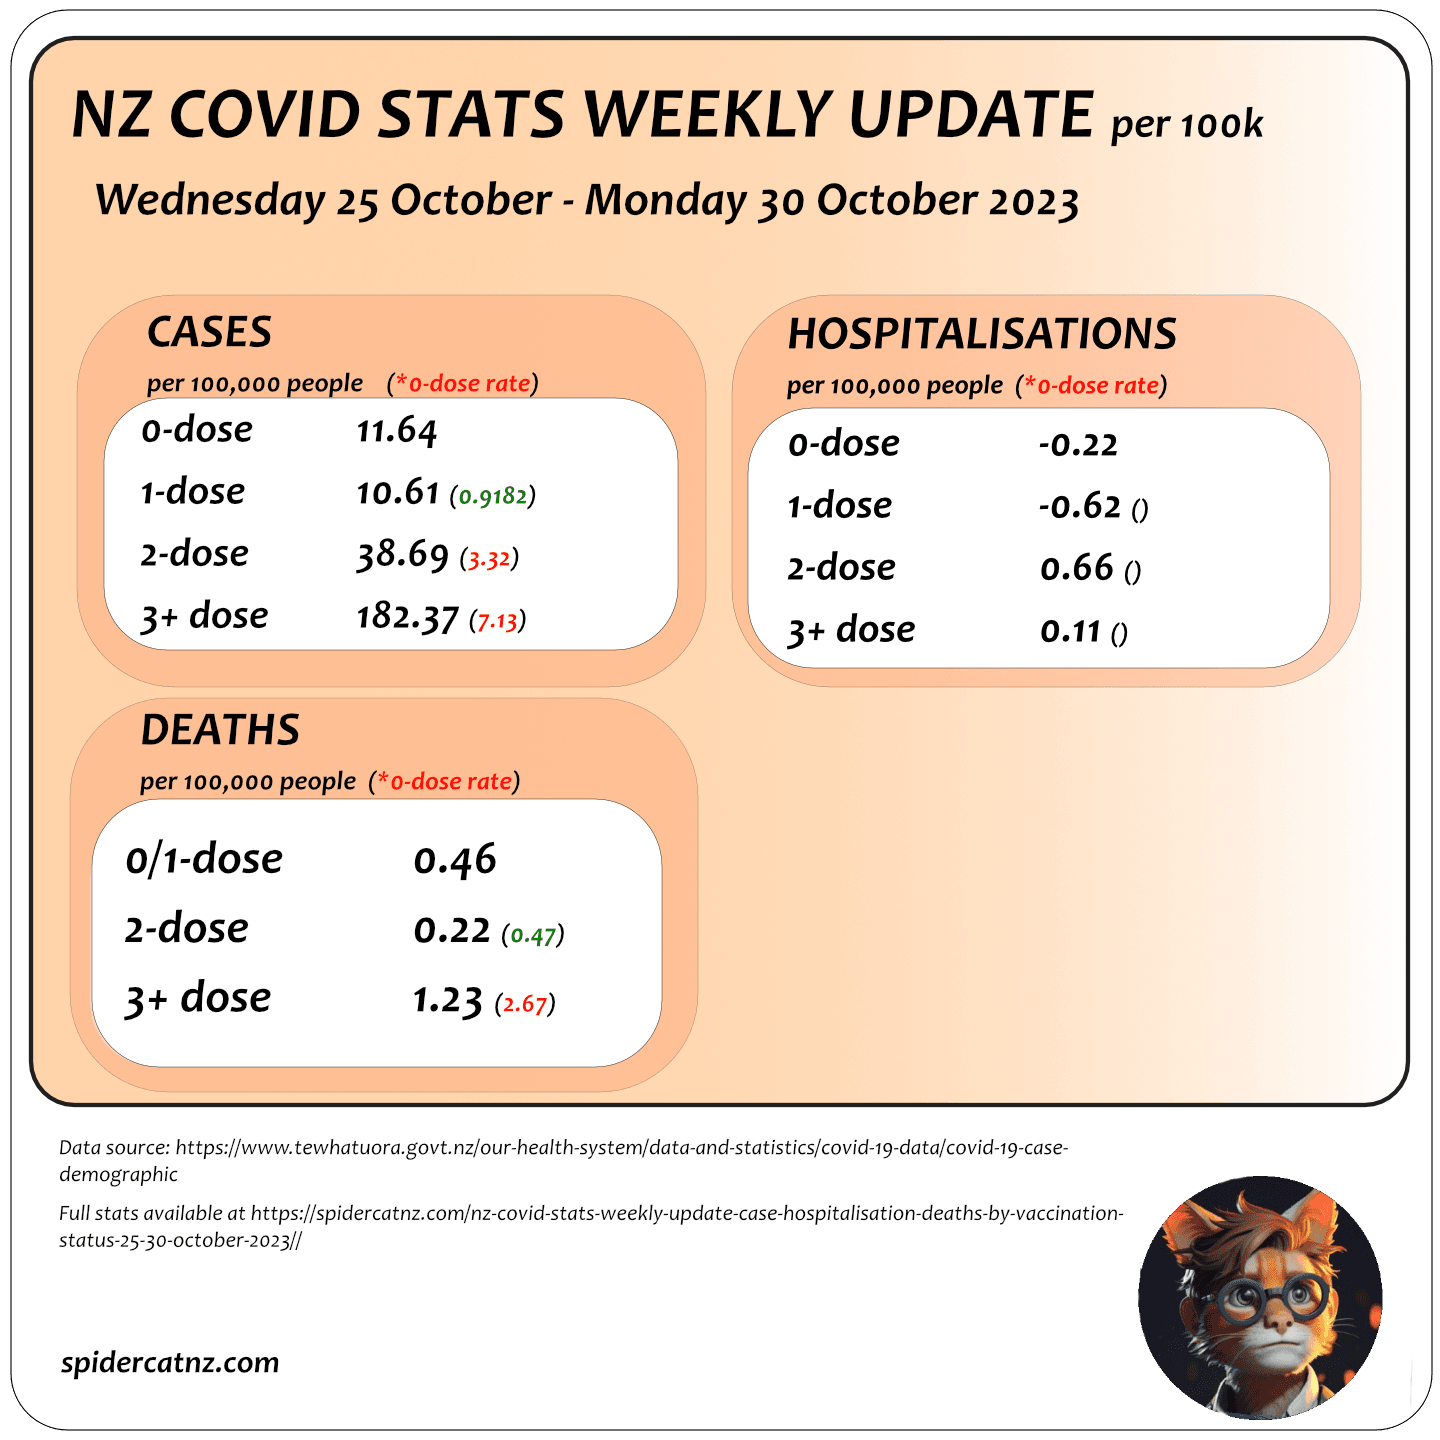
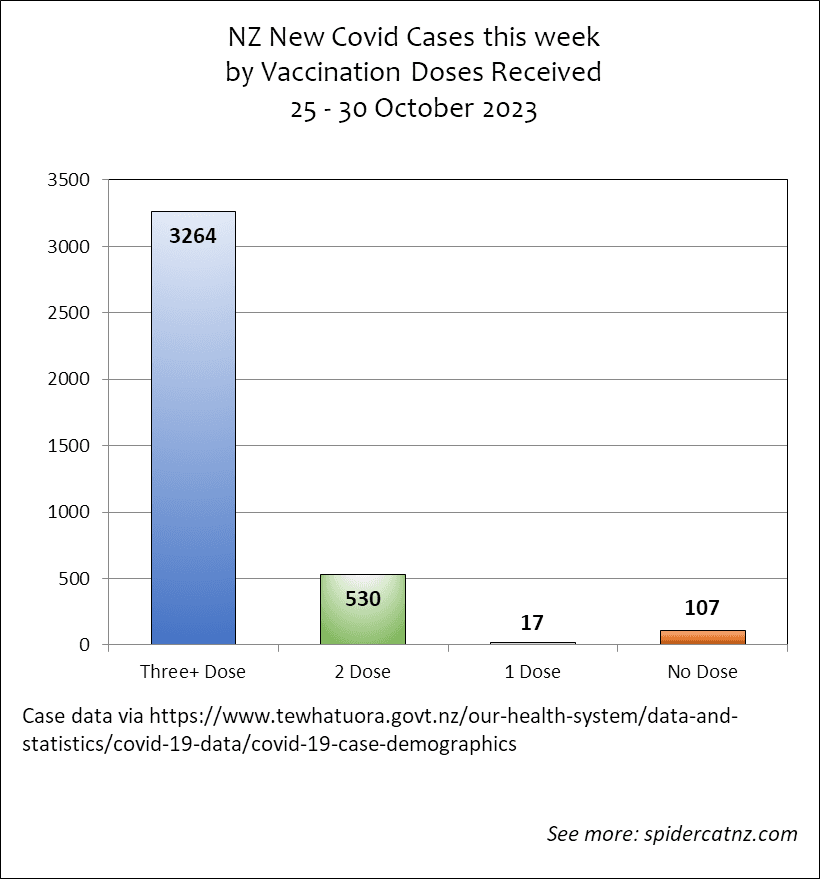
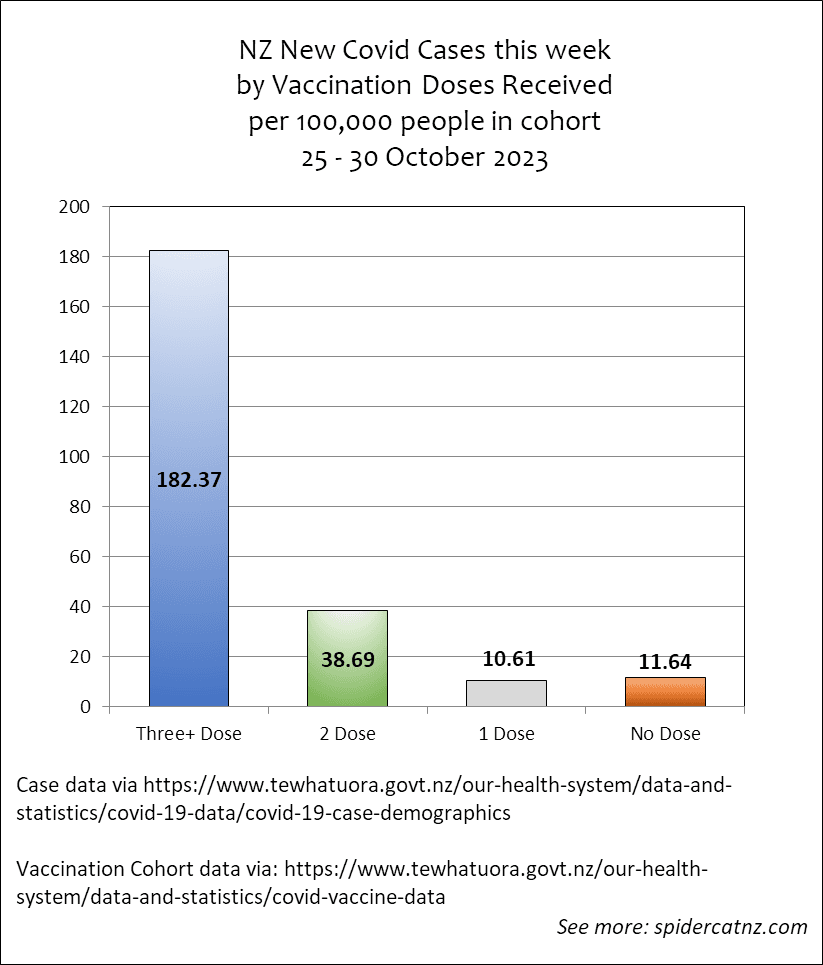
New Cases This Week
This week, over 15x the rate of infection for the Boosted compared to the 0-dose (15.66x).


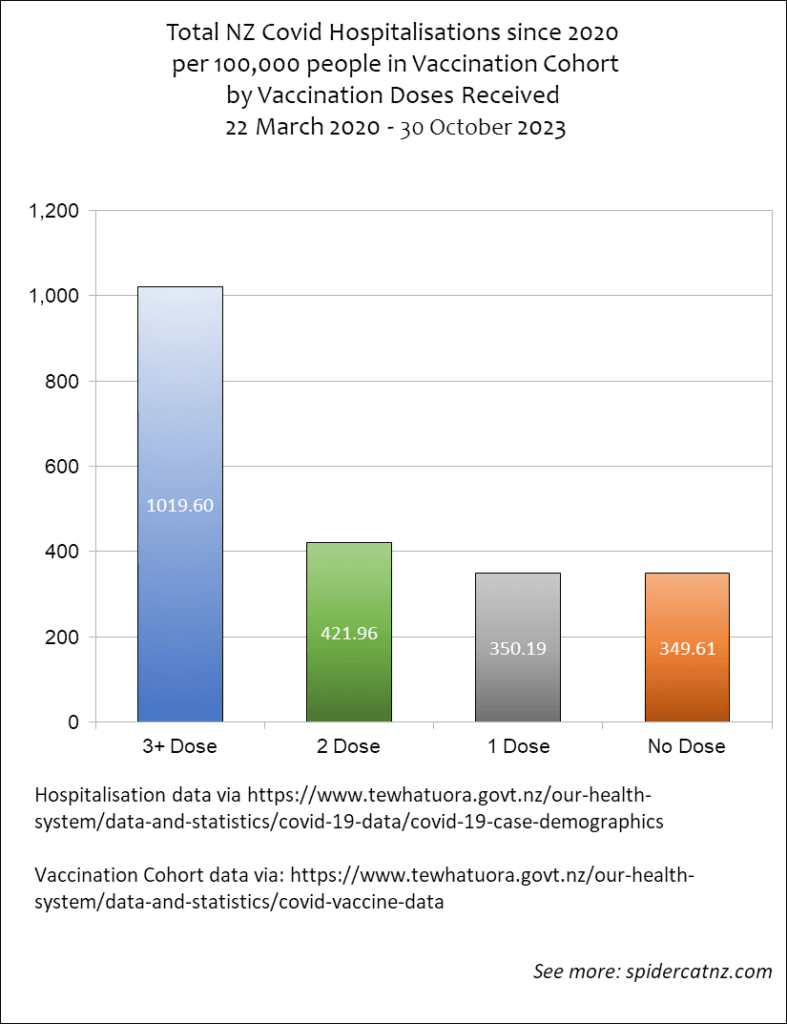
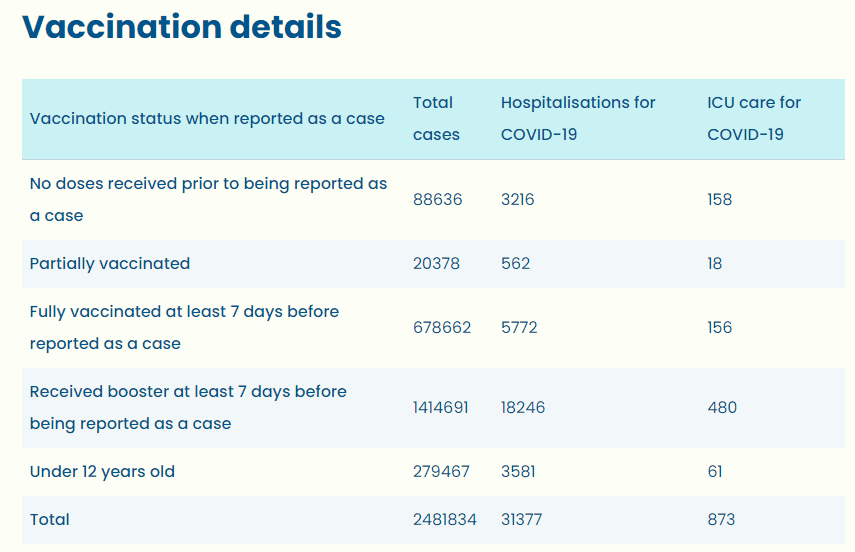
Hospitalisations
Overall Hospitalisations
As with cases, the 0 dose cohort has taken over 3 years to make this number. Boosted, 20+ months.

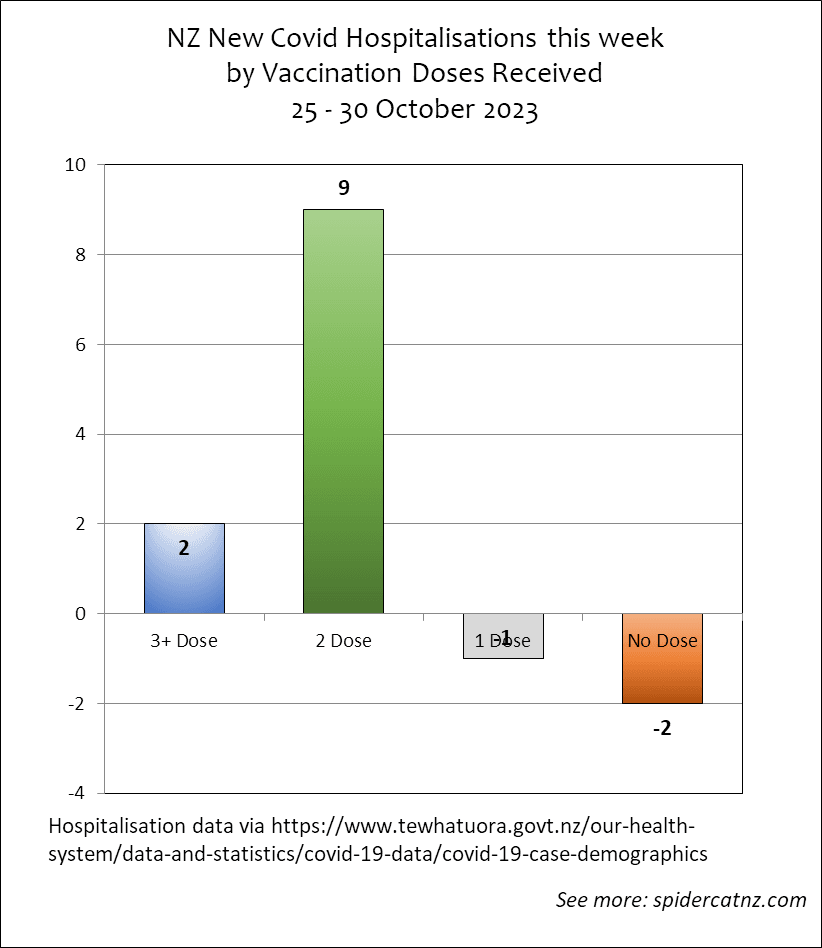
New Hospitalisations This Week
A reallocation week for HNZ/MoH, by the looks of things. This data is fairly meaningless.
2 of last week’s 0-dose hospitalisations, and 1 of the 1-dose appear to have turned out to be 2-dose.

Deaths
Overall Deaths With Covid within 28 days of death
First reported NFV death – March 2020.
First reported Boosted death – March 2022
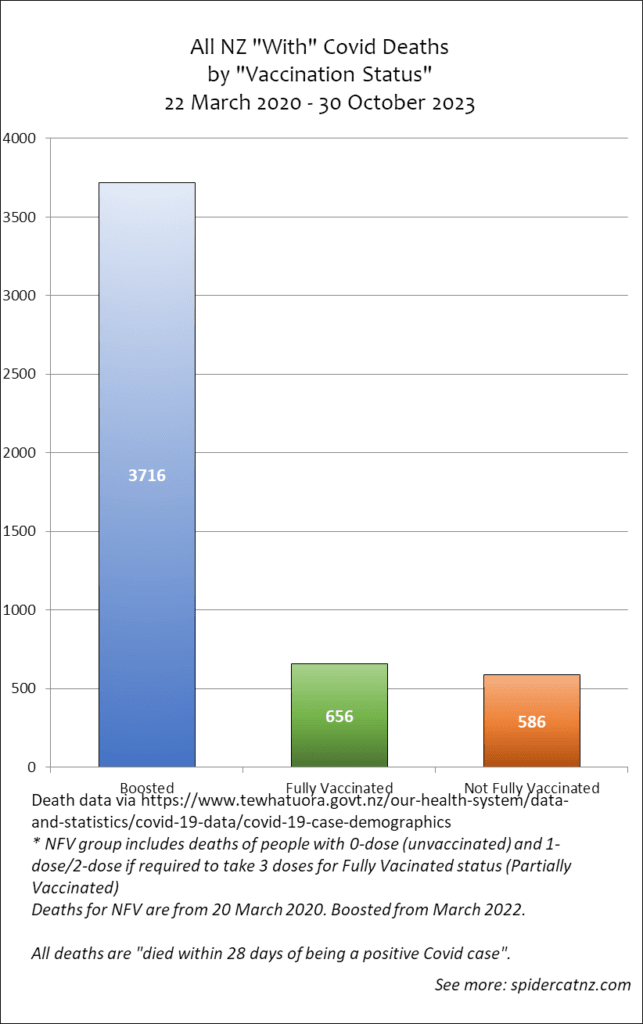
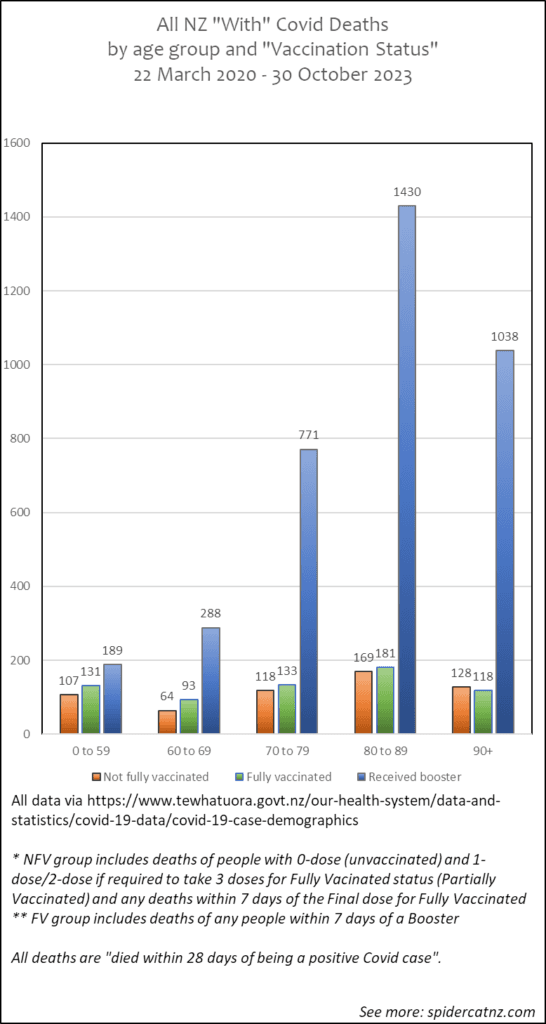
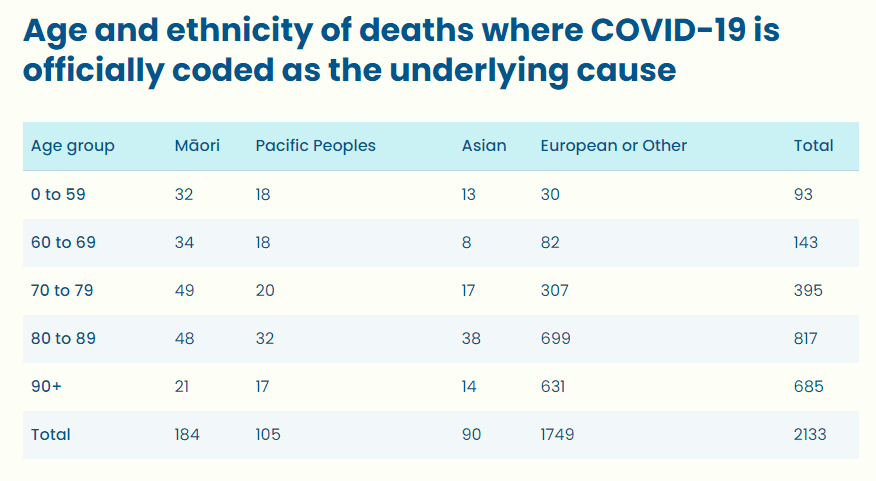
The distribution of the overall “with Covid” deaths by age and vaccination status:
Not Fully Vaccinated: (586) 107x 0-59, 64x 60s, 118x 70s, 169x 80s, 128x 90s
Fully Vaccinated: (656) 131x 0-59, 93x 60s, 133x 70s, 181x 80s, 118x 90s
Boosted: (3718) 189x 0-59, 288x 60s, 771x 70s, 1430x 80s, 1038x 90+
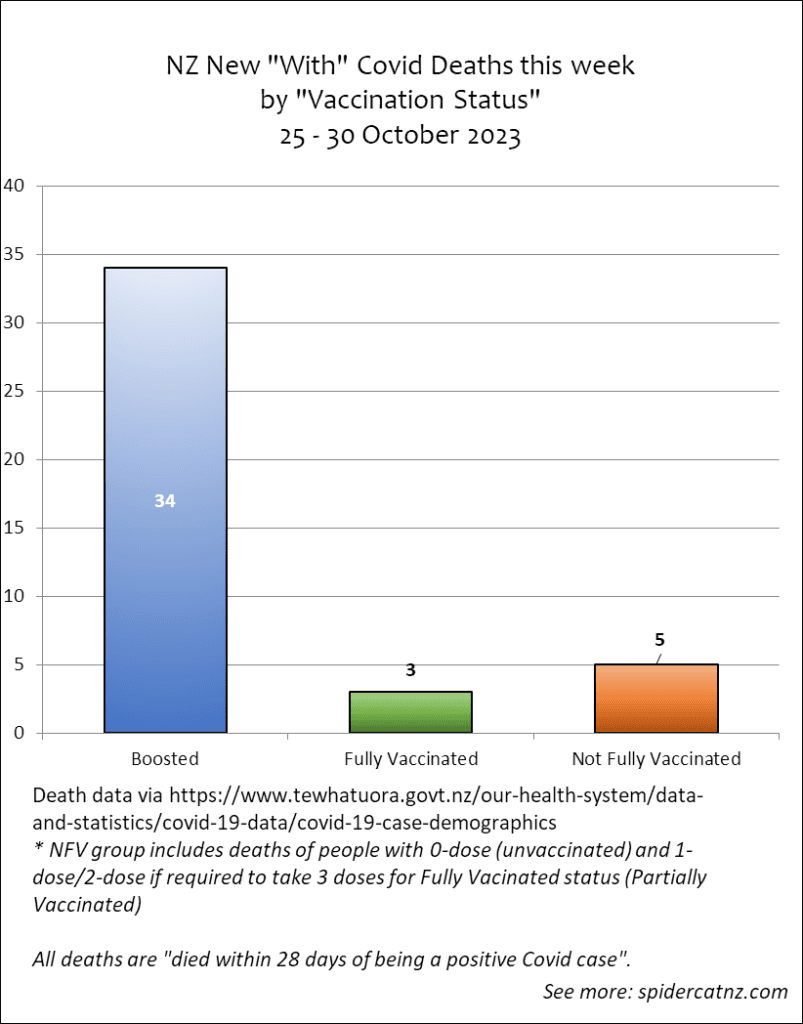
New Deaths With Covid within 28 days this week
In the last week Nearly 7x as many Boosted people died with Covid (35) as Unvaccinated. (5).
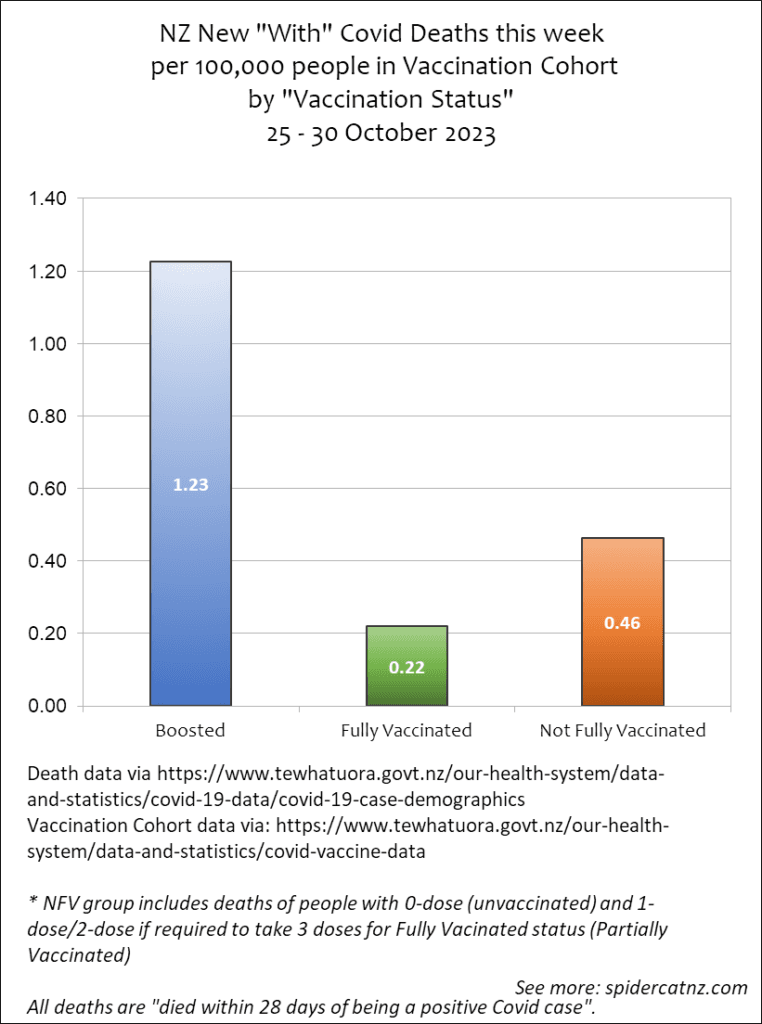
As for the per-capita rate, for every 100,000 Boosted people, 1.23 died with Covid compared to 0.46 Unvaccinated.
2.67x the per-capita.
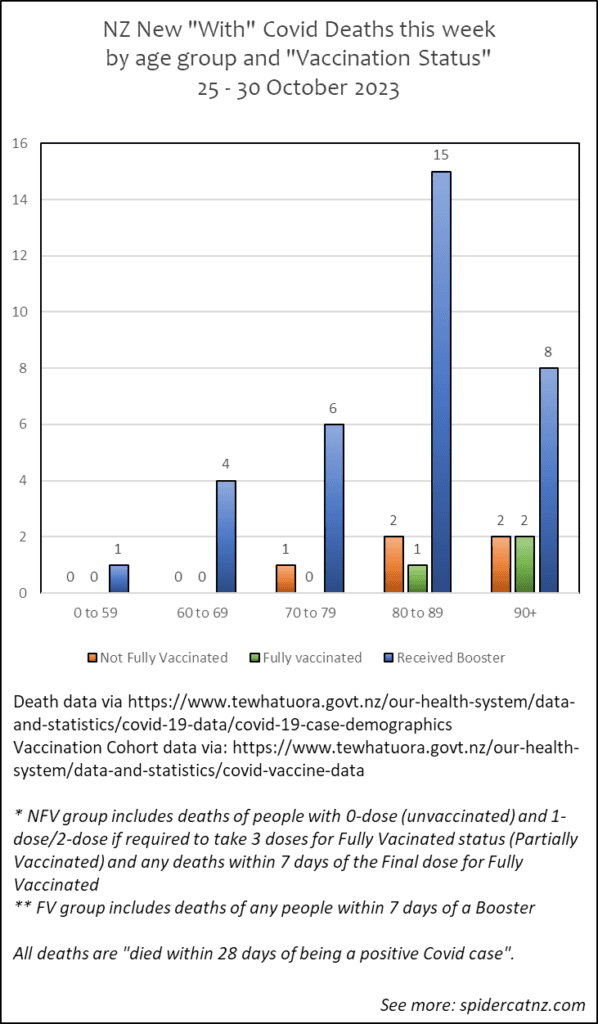
The distribution of the week’s deaths by age and vaccination status:
Unvaccinated/Partially Vaccinated: (5) 1x 70s, 2x 80s, 2x 90+
Fully Vaccinated: (3) 1x 80s. 2x 90+
Boosted: (34) 1x <60s, 4x 60s, 6x 70s, 15x 80s, 8x 90+
Vaccination Group Charts
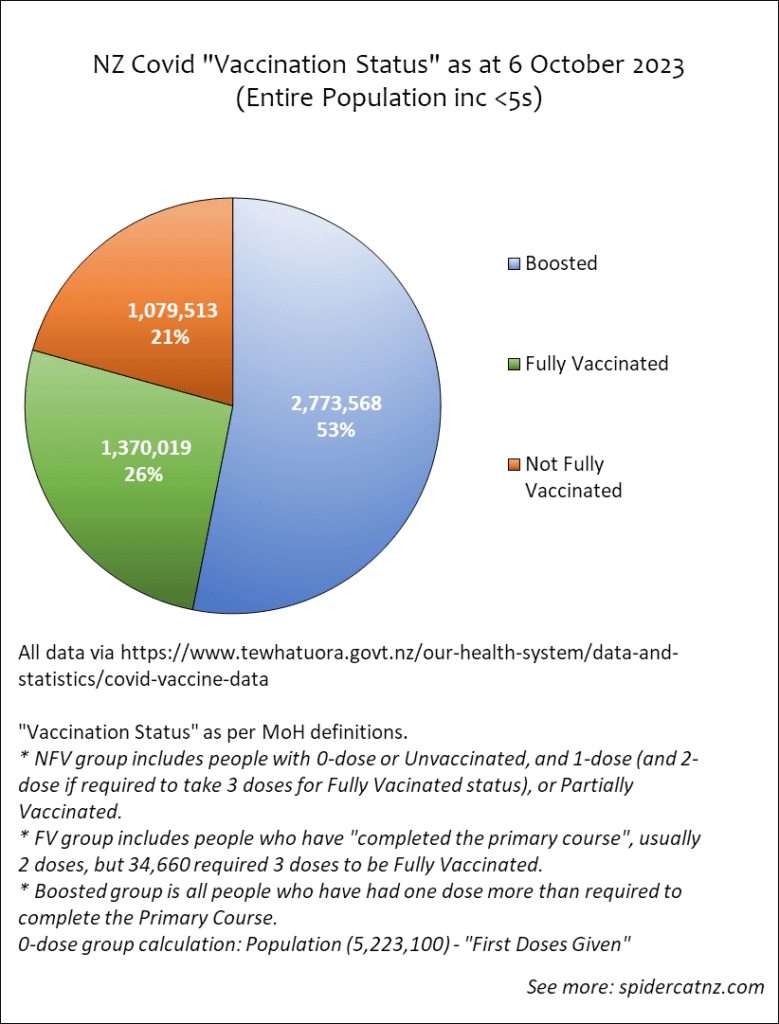
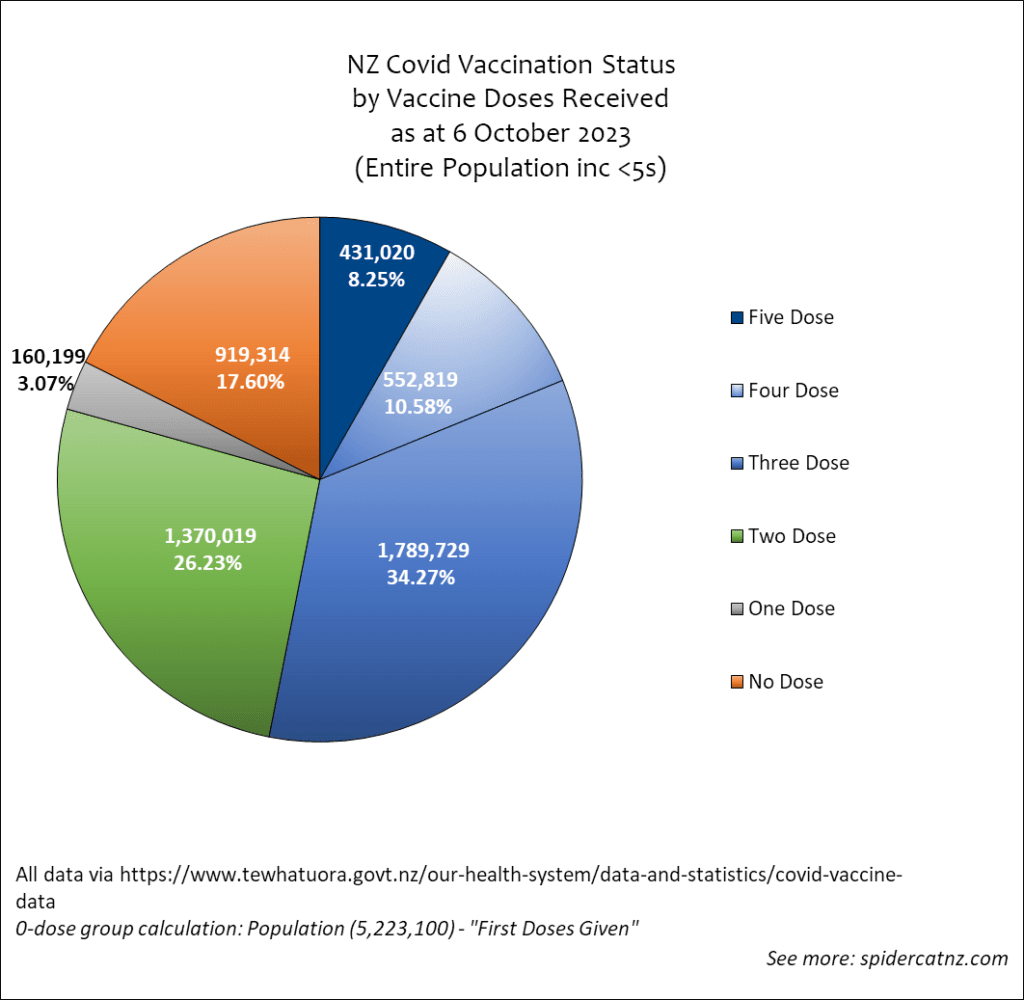
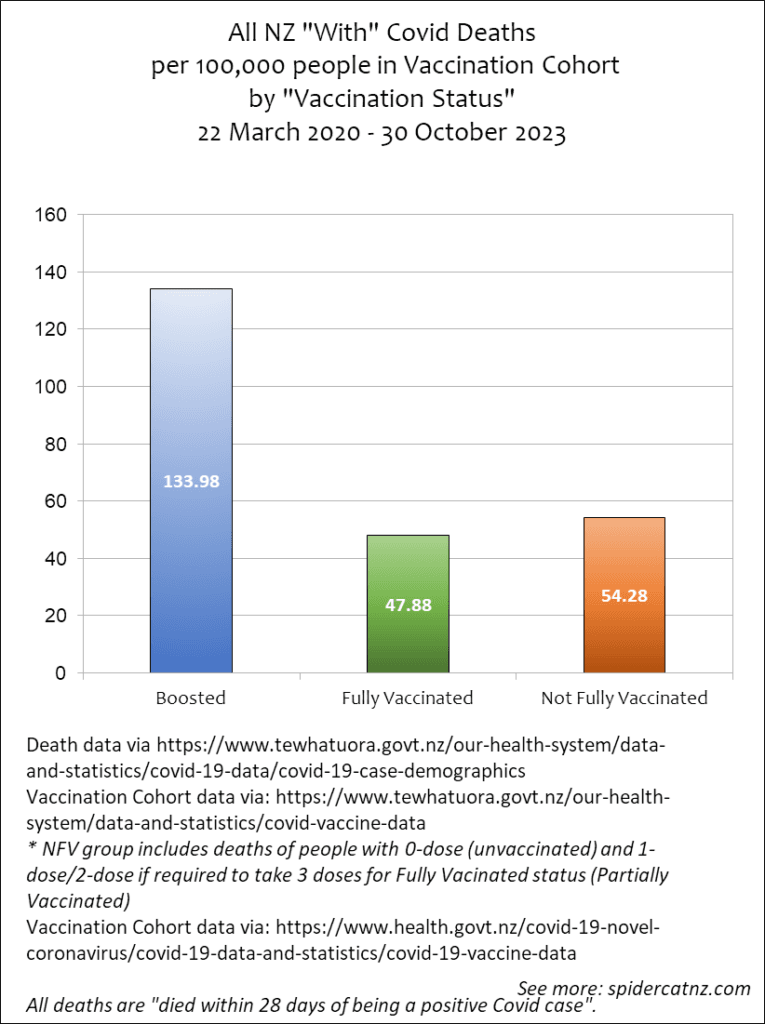
Vaccine Cohort Data

Vaccine Cohort data is as per update on 22 September 2023 (as the per-100k graphs are based on the CURRENT Vaccination Cohort numbers, the Overall graphs will not be precise. The “New This Week” graphs are as accurate as they can possibly be).