


The ongoing public debate over vaccine safety in New Zealand reached a fever pitch in late 2023 with the publication and subsequent takedown of leaked COVID-19 vaccination data. Promoted by Liz Gunn and Steve Kirsch as conclusive evidence of vaccine harm, the dataset was in fact both partial and misleading. In this article, I compare what that stolen dataset claimed to show with the vastly more comprehensive and lawfully obtained datasets that are now available for public analysis.
Background: The Data Theft
In late 2023, Barry Young—an employee with access to internal Te Whatu Ora (Health NZ) systems—illegally extracted and distributed a dataset to, among many other disparate parties, political hopeful, NZ Loyal party leader, Liz Gunn. The resulting presentation, titled “The Mother of All Revelations” (MOAR), was promoted as proof that the COVID-19 vaccines had caused mass death. The dataset was then analysed by American commentator Steve Kirsch, who released it on Wasabi cloud storage before it was removed via court injunction.
Barry Young was charged with dishonestly accessing government systems. Contrary to claims made in the media storm that followed, this data breach was not protected under whistleblower legislation.
At the time, the data was “rubbished” by the “experts”, with one “expert” saying in December 2023:
“This is quite classic,” vaccine safety expert and Associate Professor Helen Petousis-Harris said. “This is what people who are in this game do all the time. They take people who’ve had an event [like] an illness or death, and they attribute it to exposure to a vaccine.
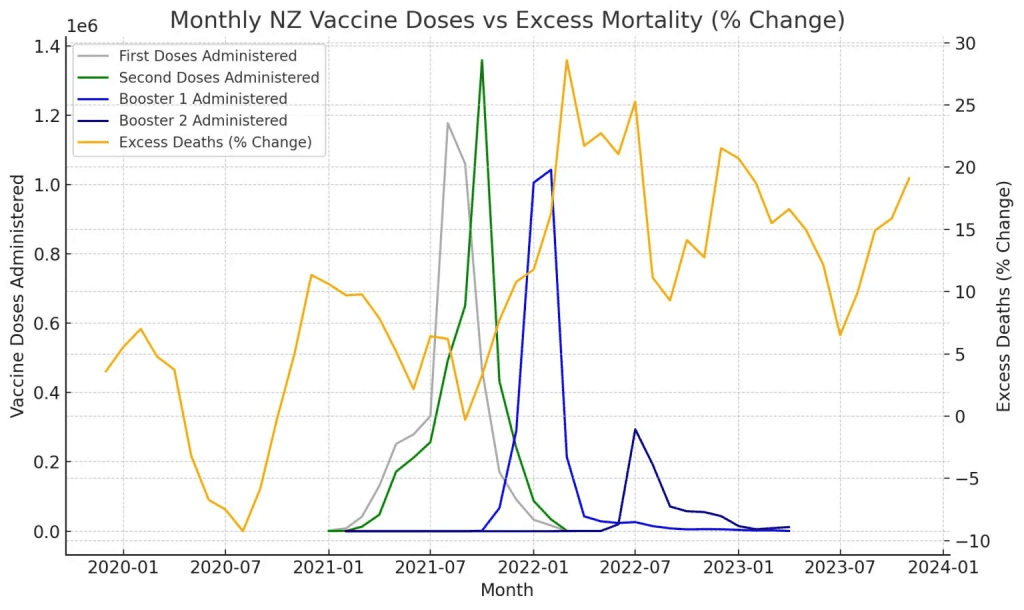
“If you go out and you vaccinate 90% of the population. Of course, people are going to continue to die as per normal. We saw an increase in mortality at the increase of Covid outbreaks.”
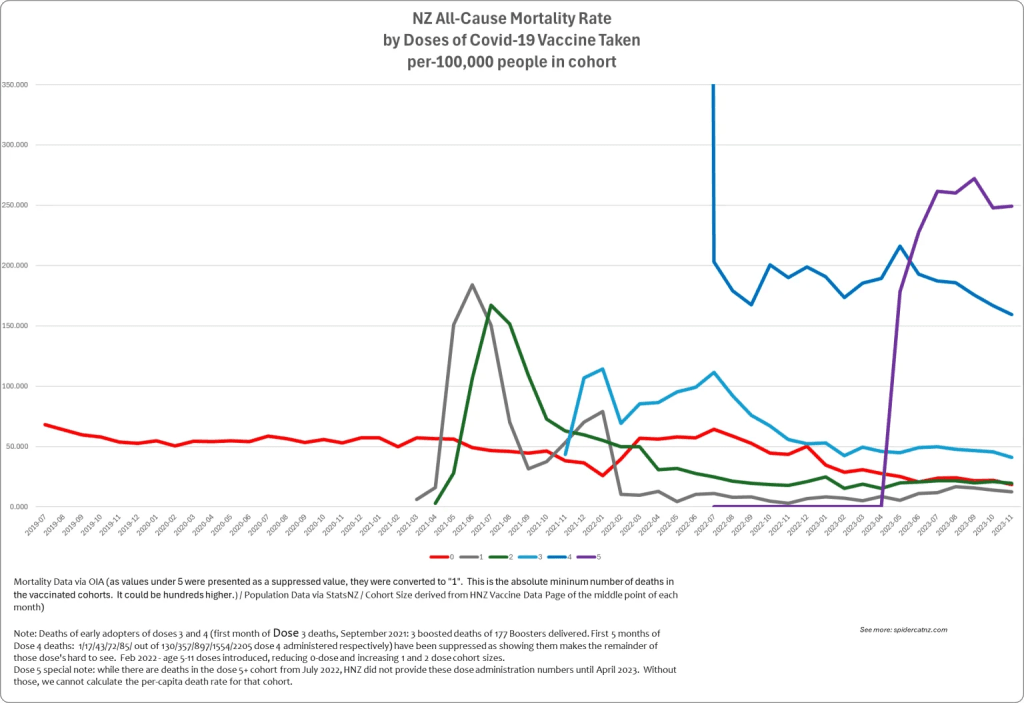
Yes, if you go out and dose 90% of the population, something is going to happen. It almost looks to me like that increase in EXCESS Mortality (that’s above the 5-year rolling average) happened after that dosing, and immediately after the third dose, with another spike after dose 4 rolled out.
Or we could break it down by the number of people in each Dose Cohort and multiply by 100k to get a population-adjusted death rate:
The Ethical and Statistical Issues
The dataset in question originated from New Zealand’s pay-per-dose vaccination scheme, which included mobile providers, pharmacies, GPs, and vaccination teams sent to end-of-life care facilities. It captured fewer than 4 million of the estimated 11–12 million total doses administered.


Its skew toward vulnerable populations—elderly, immunocompromised, and terminal patients—meant that a higher number of post-vaccination deaths was to be expected. Yet the analysis presented by Liz Gunn and Steve Kirsch ignored this foundational context, instead claiming:
- “Tens of thousands” of deaths were vaccine-induced
- People dosed at the same clinic on the same day all died “in close temporal proximity”
As I noted in my October and December blog posts (MOAR Analysis 1 and MOAR Analysis 2), these claims were made without supplying verifiable evidence.
The Misuse of Metrics
Steve Kirsch applied a method he now refers to as the KCOR (Kirsch Cumulative Outcomes Ratio)—a proprietary name he assigned to his method of dividing deaths per dose cohort by the number of people in that cohort, and plotting the result.
But the stolen and leaked dataset:
- Had no linkage to CARM (New Zealand’s adverse reaction reporting system)
- Included deaths for any reason, at any time post-vaccination, up to 2 years
- Was only the pay-per dose, weighted to end-of-life facilities and other elderly communities – where people sadly do tend to die in clusters, or sooner (within 2 years, for any reason) than the community
- Was partial – less than 1 in 4 doses were captured
What the Public Data Actually Shows
Using data obtained lawfully via the Official Information Act (OIA), as well as published datasets from Health NZ, it is possible to replicate many of the same analyses in a far more reliable way:
- Weekly and monthly death counts by age and by vaccination status
- Deaths within specific windows after a dose (0–30, 31–90, etc.)
- Full dose schedule by age group across the full population
- Excess mortality trends relative to a 5-year rolling average
This allows proper calculation of per-capita outcomes, dynamic cohort sizes, and time alignment between doses and deaths. One such analysis as of March 2023 placed New Zealand’s excess mortality at ~0.7 excess deaths per 1,000 doses, using the Ministry of Health’s own HSU spreadsheet—publicly available at the time.
After the leak/theft of the data, Health NZ ceased regular updates to vaccine-related outcome reporting, removing the very statistics required to independently monitor potential harm. As of February 2024, it was no longer publicly reported how many people had tested positive, been hospitalised/admitted to ICU for Covid by dose number, or died within 28 days of a positive case by Vaccination Status.
Conclusion
Contrary to claims that data was “hidden,” the bulk of it has always been available to those who knew where to look—and how to read it. The stolen dataset was neither complete nor representative and introduced more confusion than clarity.
What we now have is better: lawfully obtained, full-population datasets with explicit definitions and clearly recorded limitations. That’s the only kind of data that can withstand scrutiny.
In short: it wasn’t the evidence they claimed. But the real evidence? It’s in plain sight.
Further Reading: