


NZ Justice Stats – Convictions – by Ethnicity – 1980 – 2024
Over four decades, Māori convictions in New Zealand courts have surged to 44%, now surpassing Europeans, highlighting growing ethnic disparities ...

Over four decades, Māori convictions in New Zealand courts have surged to 44%, now surpassing Europeans, highlighting growing ethnic disparities ...
Latest 2024 data reveals Māori remain overrepresented in New Zealand’s justice system.

New Zealand's prison population surpasses 10,000 for the first time in four years, highlighting ongoing disparities with Māori overrepresentation and ...

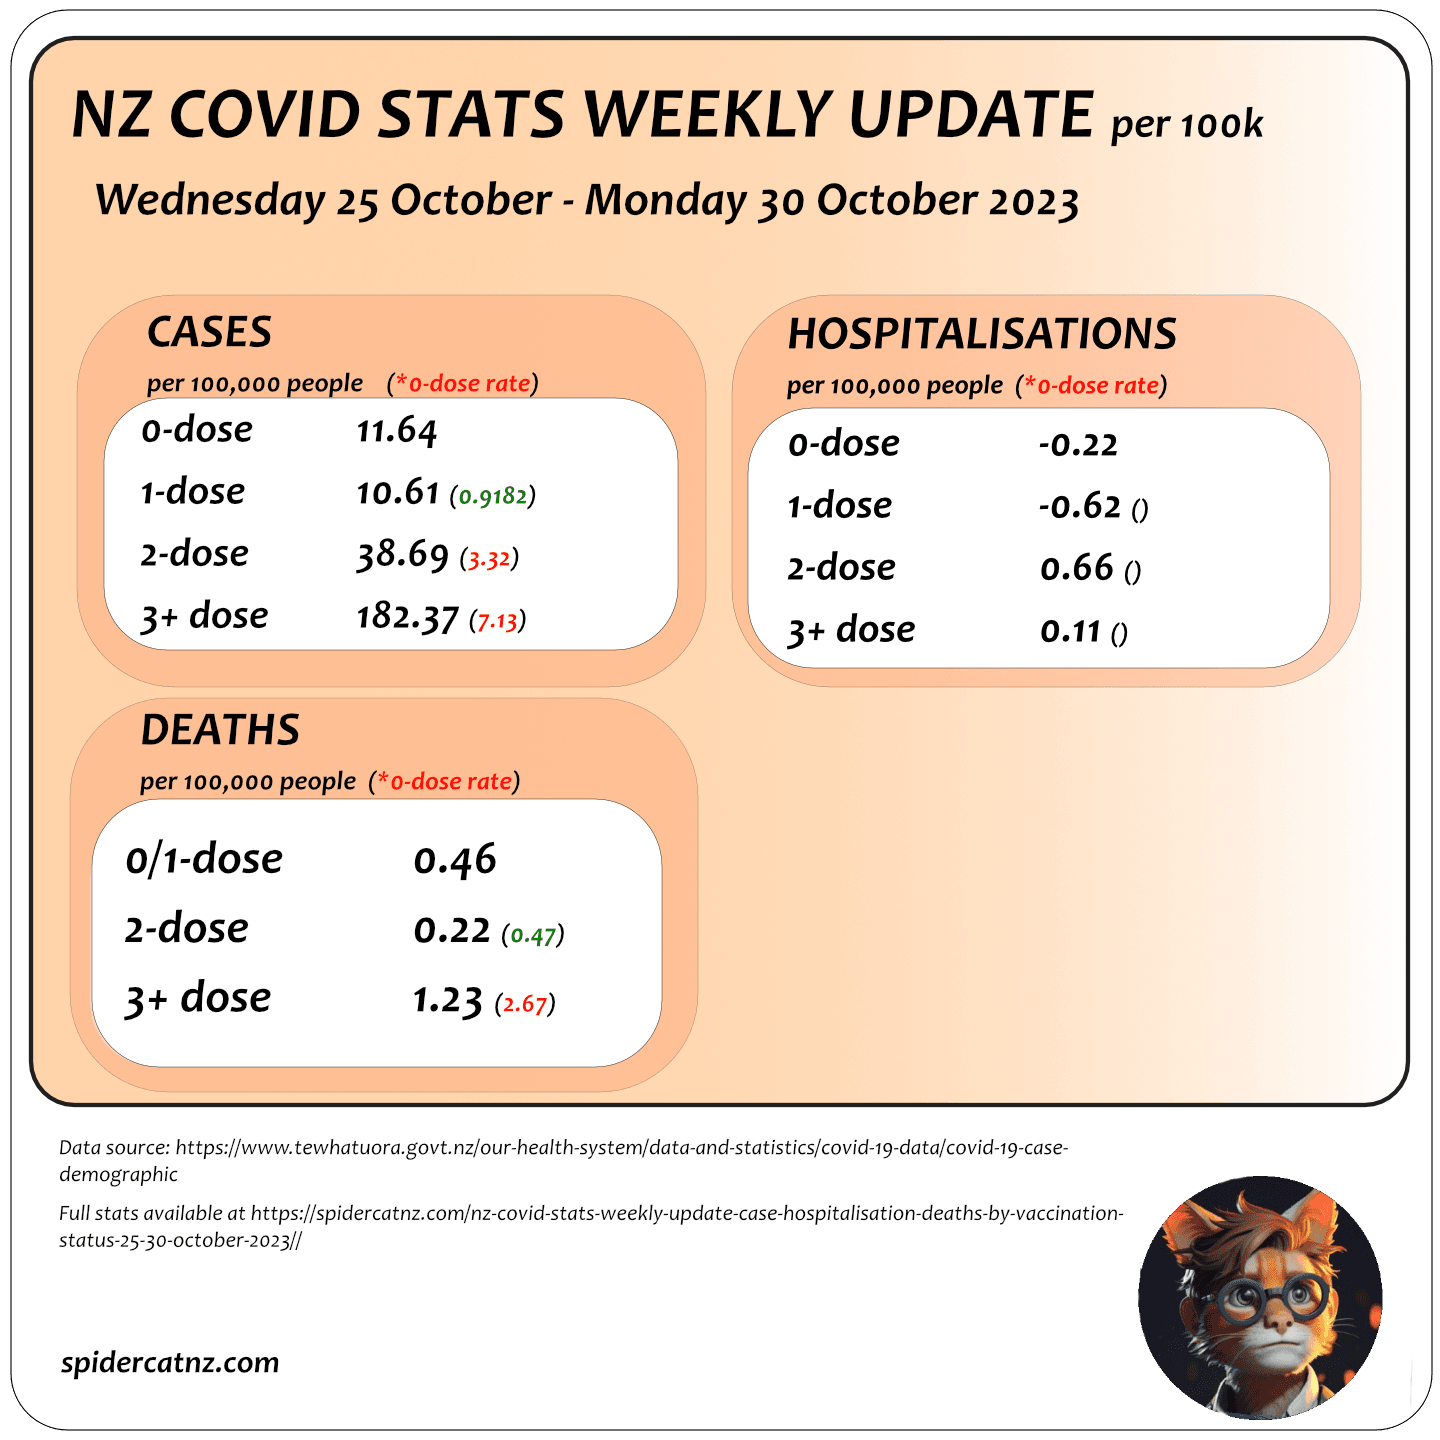
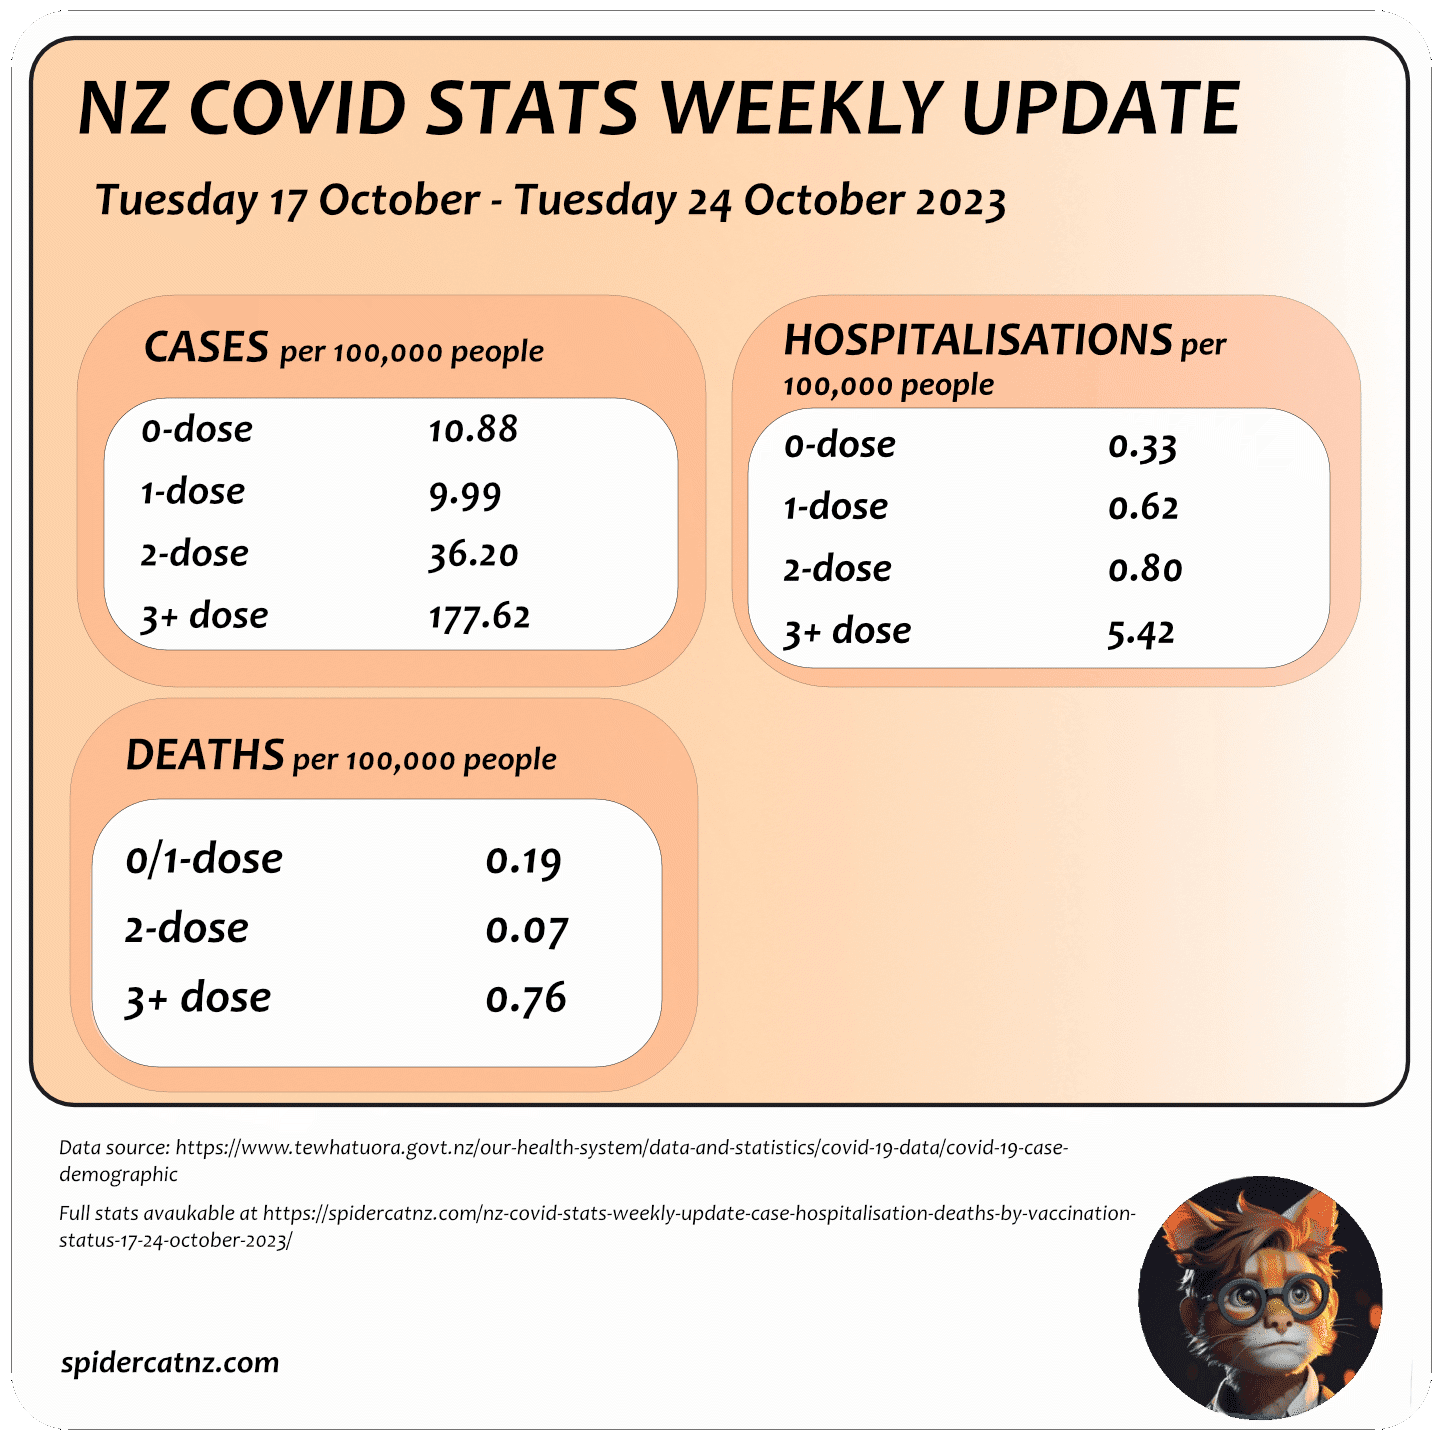
Analyzing COVID-19 death trends in New Zealand for 2023 reveals surprising insights into vaccination status and mortality rates throughout the ...

Those of you who know of my weekly updates may know (I assume you look at the footer of the ...

Since the Excess Mortality after Vaccination became obvious, the "authorities" have used various "experts" to show that "Well, actually, when ...

Discover the hidden posts about Jacinda’s "Let's Talk About Side Effects," including Part Three and beyond—coverage of the deleted content ...
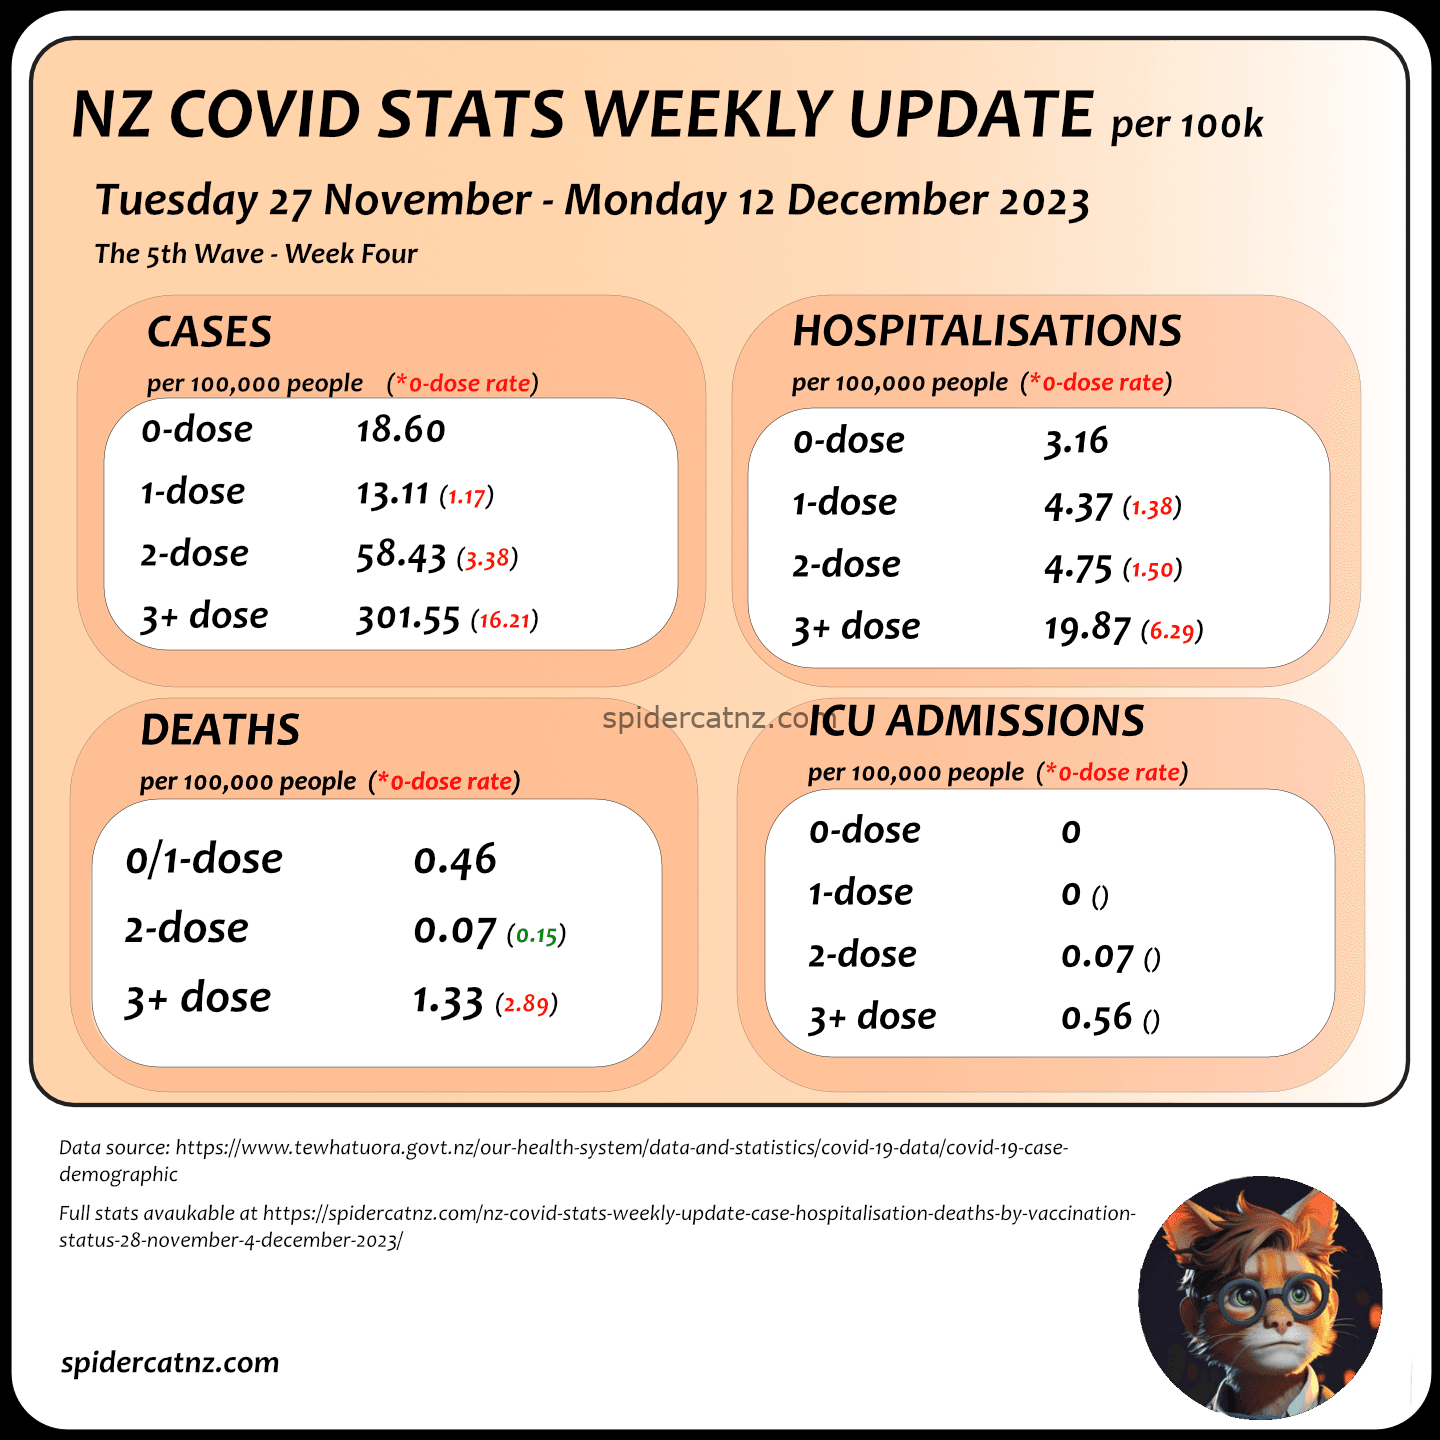
We are now into week Four of the Fifth NZ Covid Wave. Last week, the Boosted topped all the categories. ...
Back in late October, Liz Gunn released her first MOAR video - The Mother Of All Revelations. You can find ...
Cases Overall Cases since First Recorded Case For the No Dose group, the first case is from March 2020. 40+ ...
An update to the earlier article that gave these stats to March 2023, this one is to July 2023. Part ...
Highlights this week: Boosted 16x the rate of infection per-capita, 16x the rate of Hospitalisation and 4x the death rate ...
 SCNZ Car magnets
Price range: $7.00 through $9.00
SCNZ Car magnets
Price range: $7.00 through $9.00 SCNZ 2025 Can cooler
$8.00
SCNZ 2025 Can cooler
$8.00 SCNZ 2025 Gaming mouse pad
Price range: $25.00 through $43.00
SCNZ 2025 Gaming mouse pad
Price range: $25.00 through $43.00 SCNZ Platinum Tier
$50.00 SCNZ Premium Tier
$10.00
SCNZ Platinum Tier
$50.00 SCNZ Premium Tier
$10.00— Jacinda Ardern
