Excess Mortality in 0-0 age group
Infant Mortality in New Zealand’s 0–0 Cohort
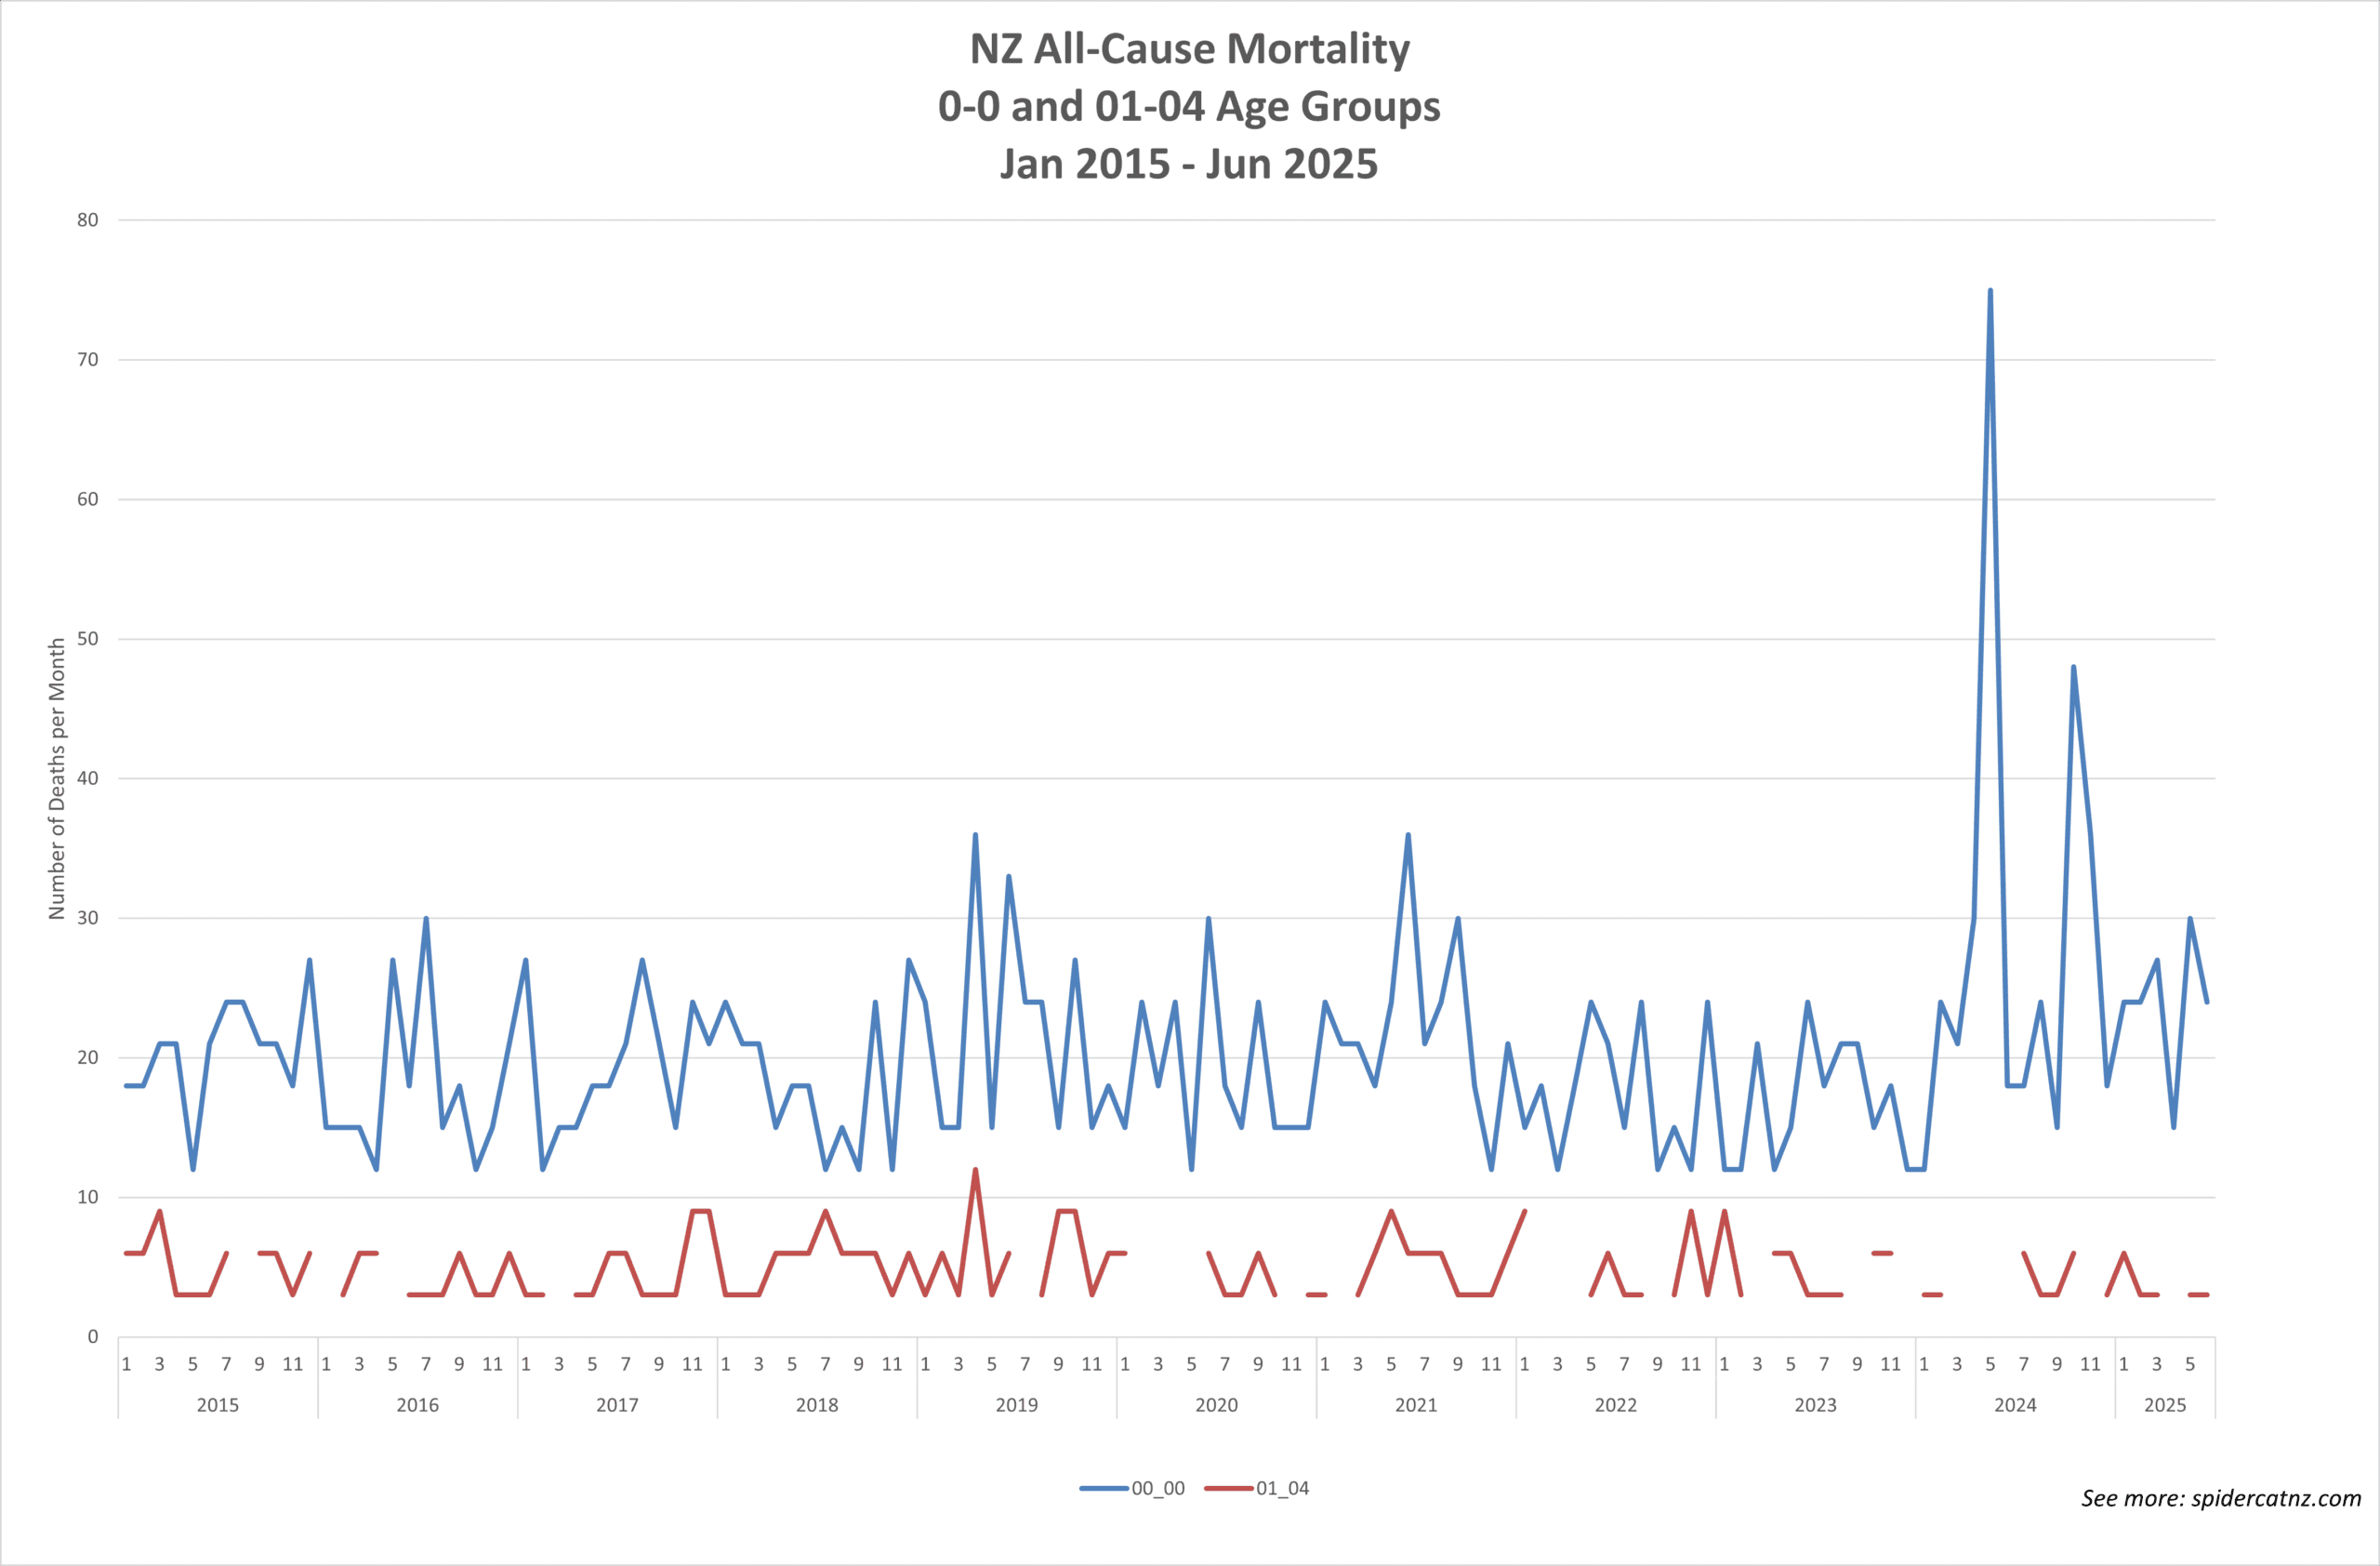
This analysis focuses on the 0–0 cohort: babies who are born but do not live to their first birthday. Historically, this group accounts for more deaths than nearly all other age groups until advanced age. Infants are especially vulnerable to health complications, and this is reflected in mortality figures.
Note: 2014 and 2024 both contain “catch-up” deaths. For 2024 in the 0-0 cohort, it’s 30 deaths, added in June 2024. Around one month’s worth.

The 0–0 vs 1–4 Comparison
Charts from Stats NZ show that within the broader under‑5 age category, the 0–0 cohort makes up almost all of the mortality. By contrast, the 1–4 age group often records months with no deaths at all. In recent years, the mortality risk for the 0–0 cohort appears to have increased.
Baseline and Excess Mortality
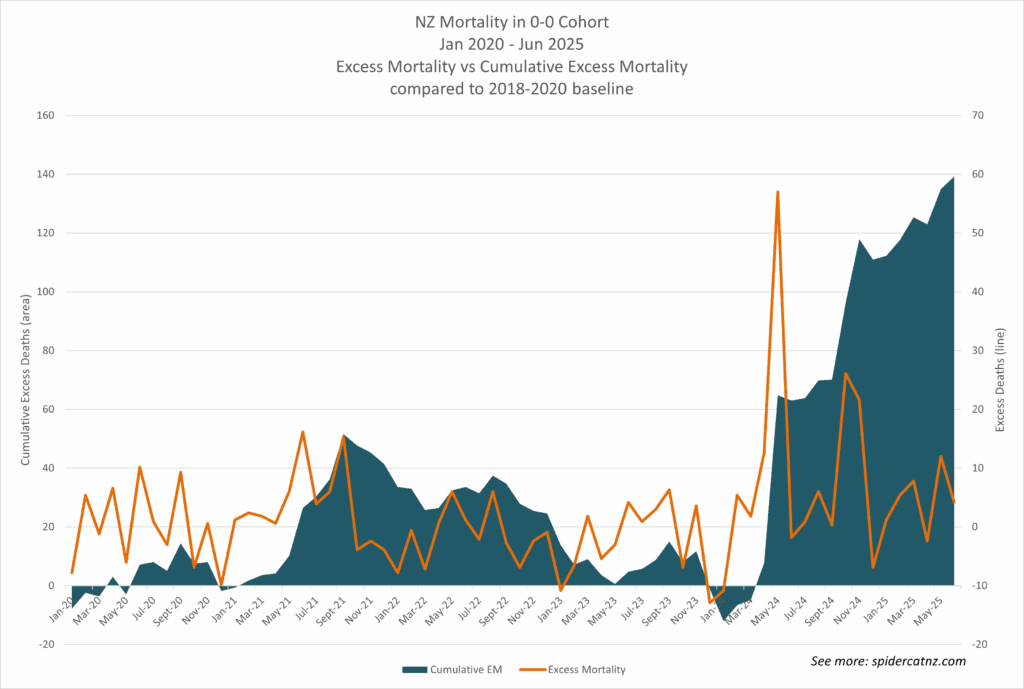
Using Stats NZ monthly mortality data, an average baseline was established from 2018 and 2019. Comparing observed deaths against this baseline allows us to track excess mortality over time:
- 2020: a small initial bump.
- May 2021 – Sept 2022: a large, sustained rise.
- May 2024: another sharp increase.
Cumulative excess mortality shows these periods clearly, with the long upward climb in 2021–22 standing out.
The Denominator Problem
Unlike older age cohorts, the 0–0 group has a moving denominator. The population “at risk” changes each quarter depending on how many live births occur. This raises the question: are more infants dying simply because there were more babies born at certain times, or has the rate of infant death genuinely increased?
To address this, we need to normalise mortality against the number of live births.
Live Births vs Infant Mortality Rate
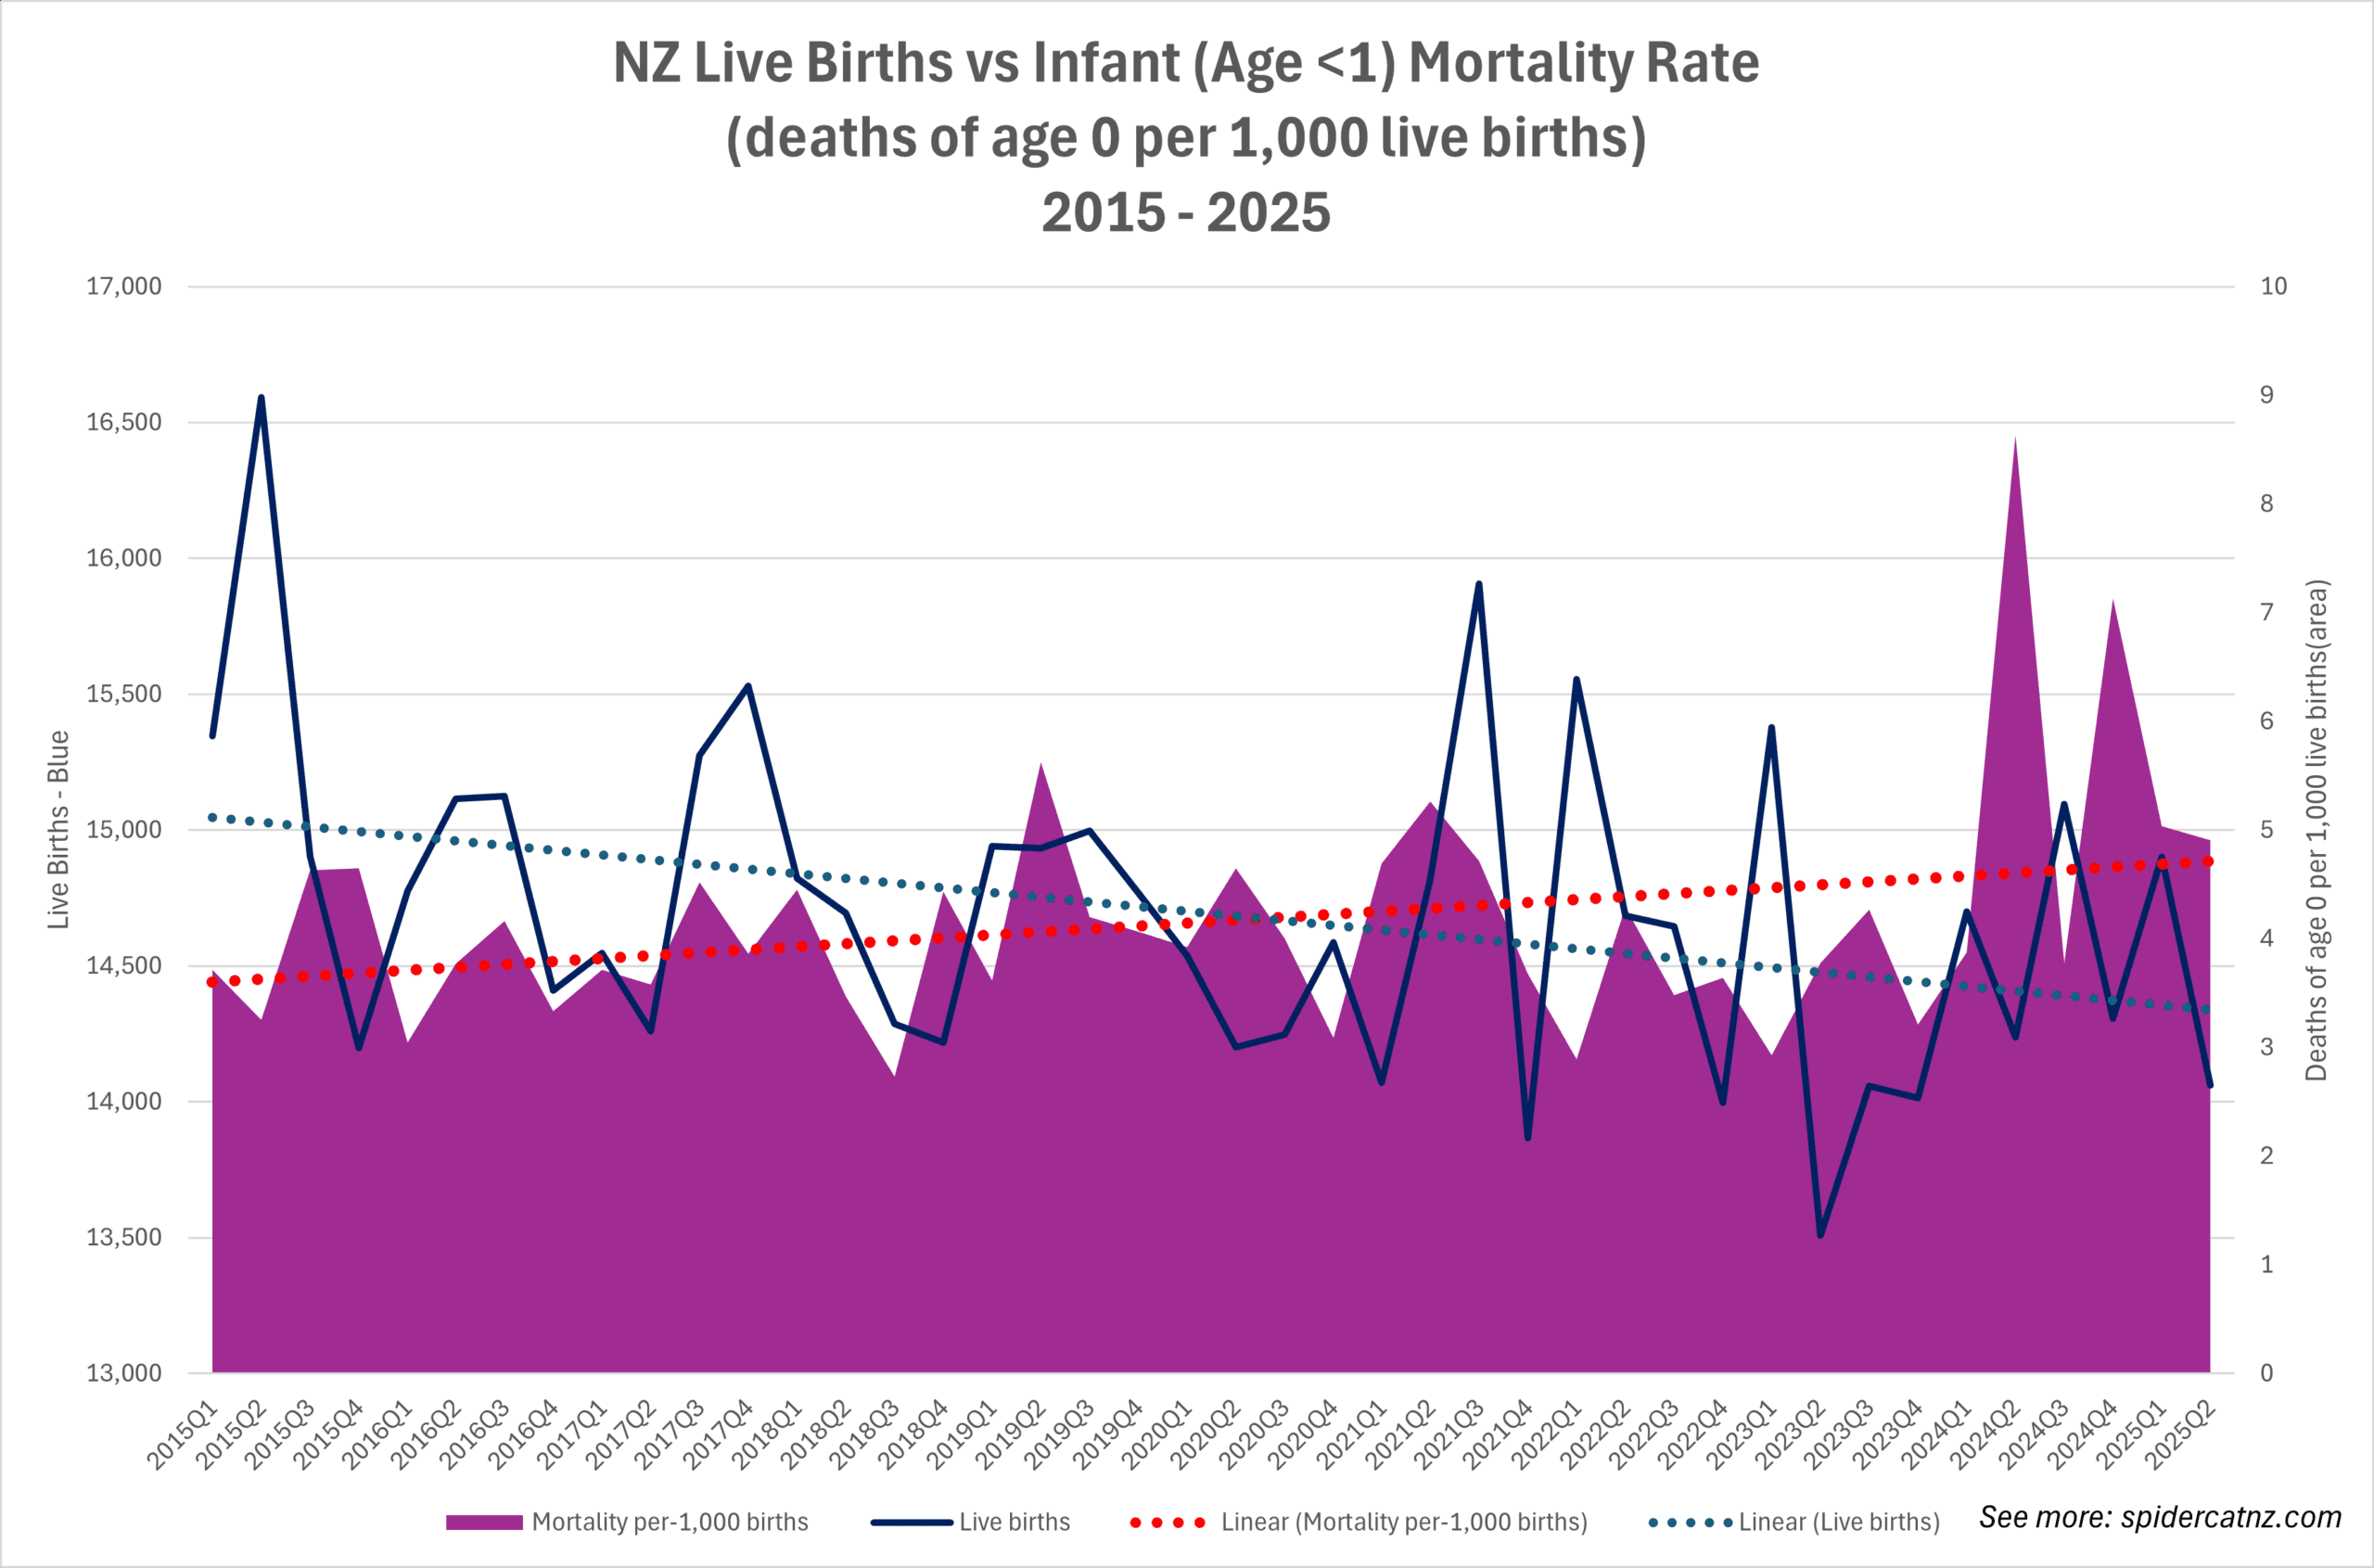
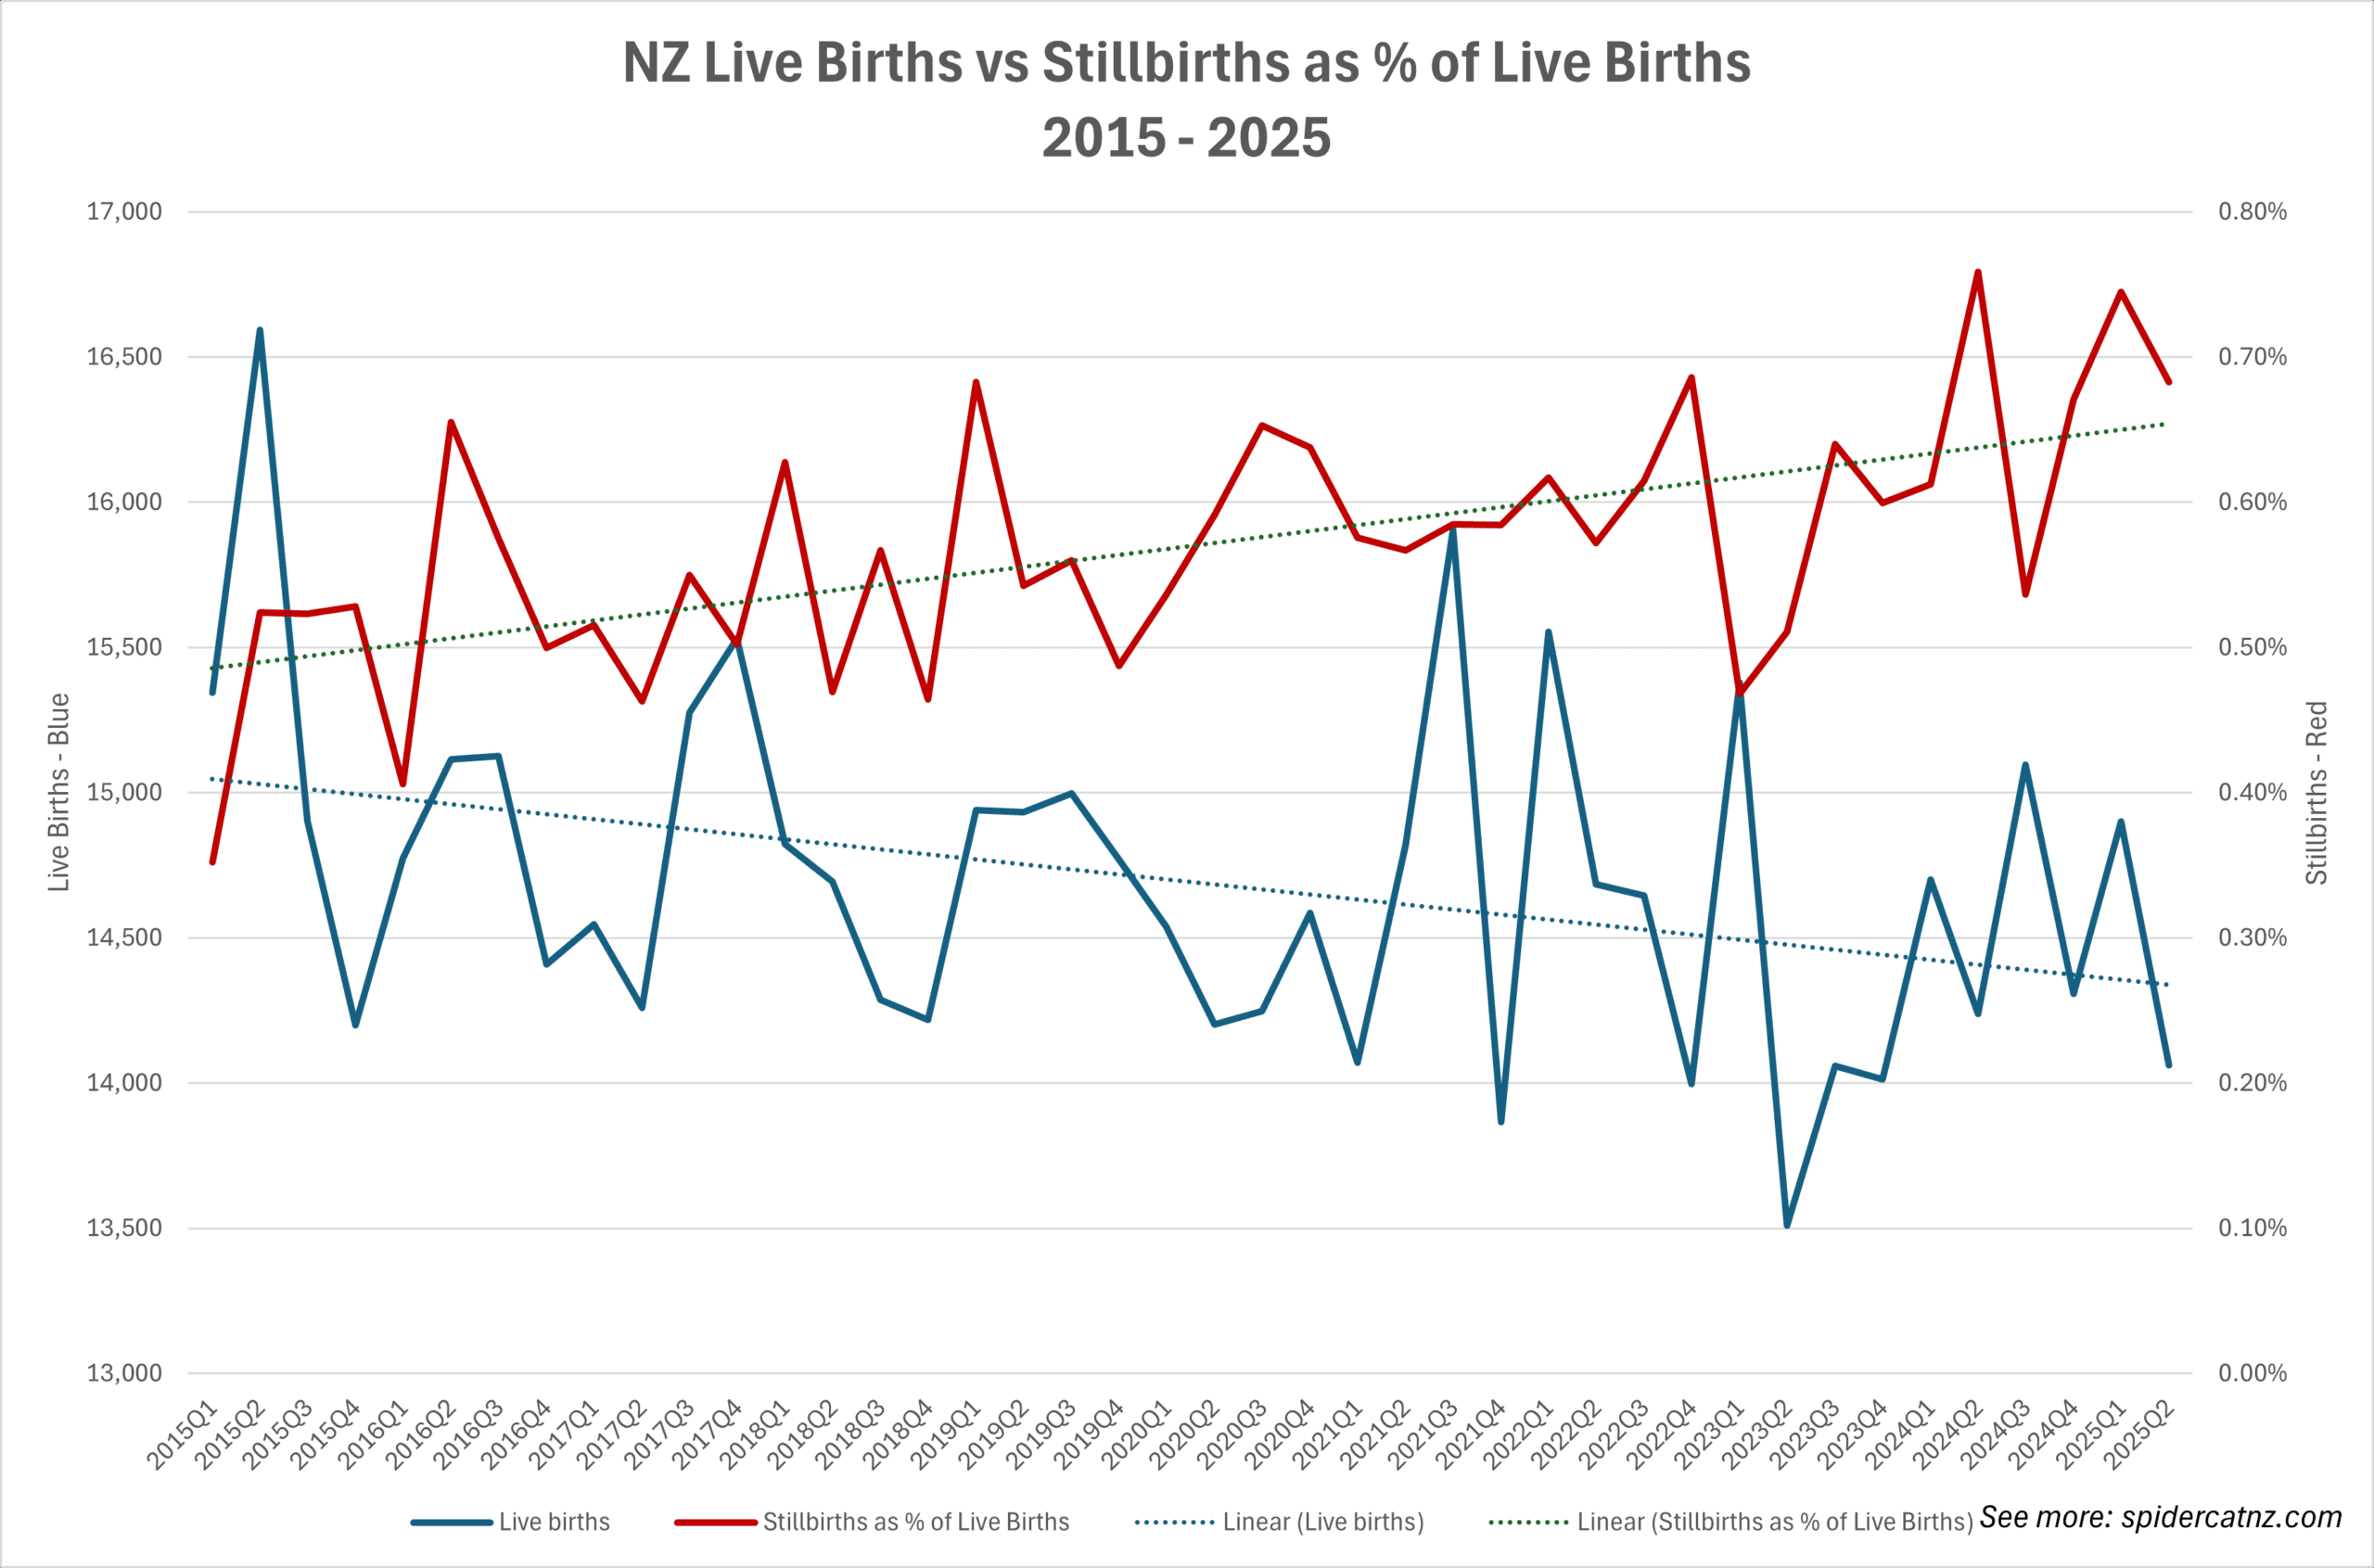
By plotting quarterly live births against infant mortality rates (deaths under age 1 per 1,000 live births), a clearer picture emerges:
- Live births have been trending downward since 2015.
- Infant mortality rate has shown an upward drift since 2020, with several quarters markedly above the 2015–2019 baseline.
This confirms that the rise is not only a function of birth numbers — the per‑1,000 risk has also been climbing.
Excess Infant Mortality Rate
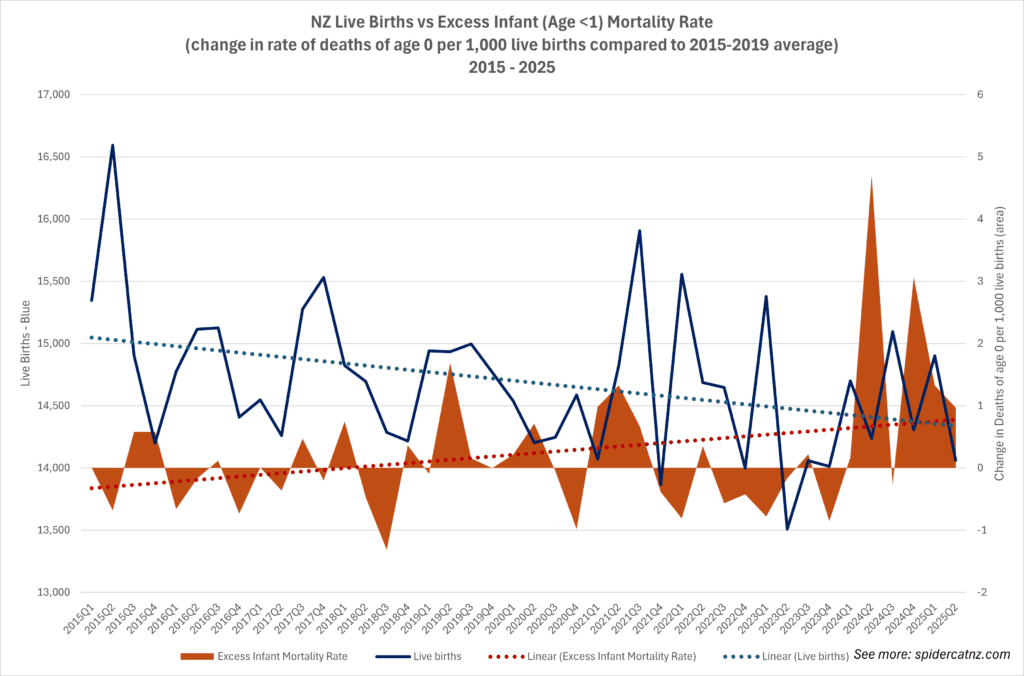
Taking the analysis further, each quarter’s infant mortality rate was compared to the 2015–2019 average for that same quarter. This method accounts for both seasonality in conception/births and declining birth totals. The result:
- Pre‑2020: infant mortality rates hovered close to the baseline, fluctuating above and below zero excess.
- Post‑2020: excess infant mortality rates are more consistently positive, with sharp spikes in 2022–24.
A cumulative excess mortality rate chart (summing quarterly deviations) shows an ongoing divergence from the pre‑pandemic baseline.
Summary
- The 0–0 cohort drives nearly all mortality in under‑5s.
- Using deaths alone suggested peaks and dips, but once normalised against live births, it is clear that infant mortality rates have risen since 2020.
- Declining birth counts cannot explain the rise. The per‑1,000 risk of dying before age one is higher than the 2015–2019 baseline.
- Sustained excess infant mortality was most evident in mid‑2021 through late‑2022, and again in 2024.
This refined method — matching quarterly rates to baseline, rather than raw deaths — ensures that both birth seasonality and falling cohort size are properly accounted for.


