Shifts in Causes of Infant Mortality in New Zealand (0–0 cohort)
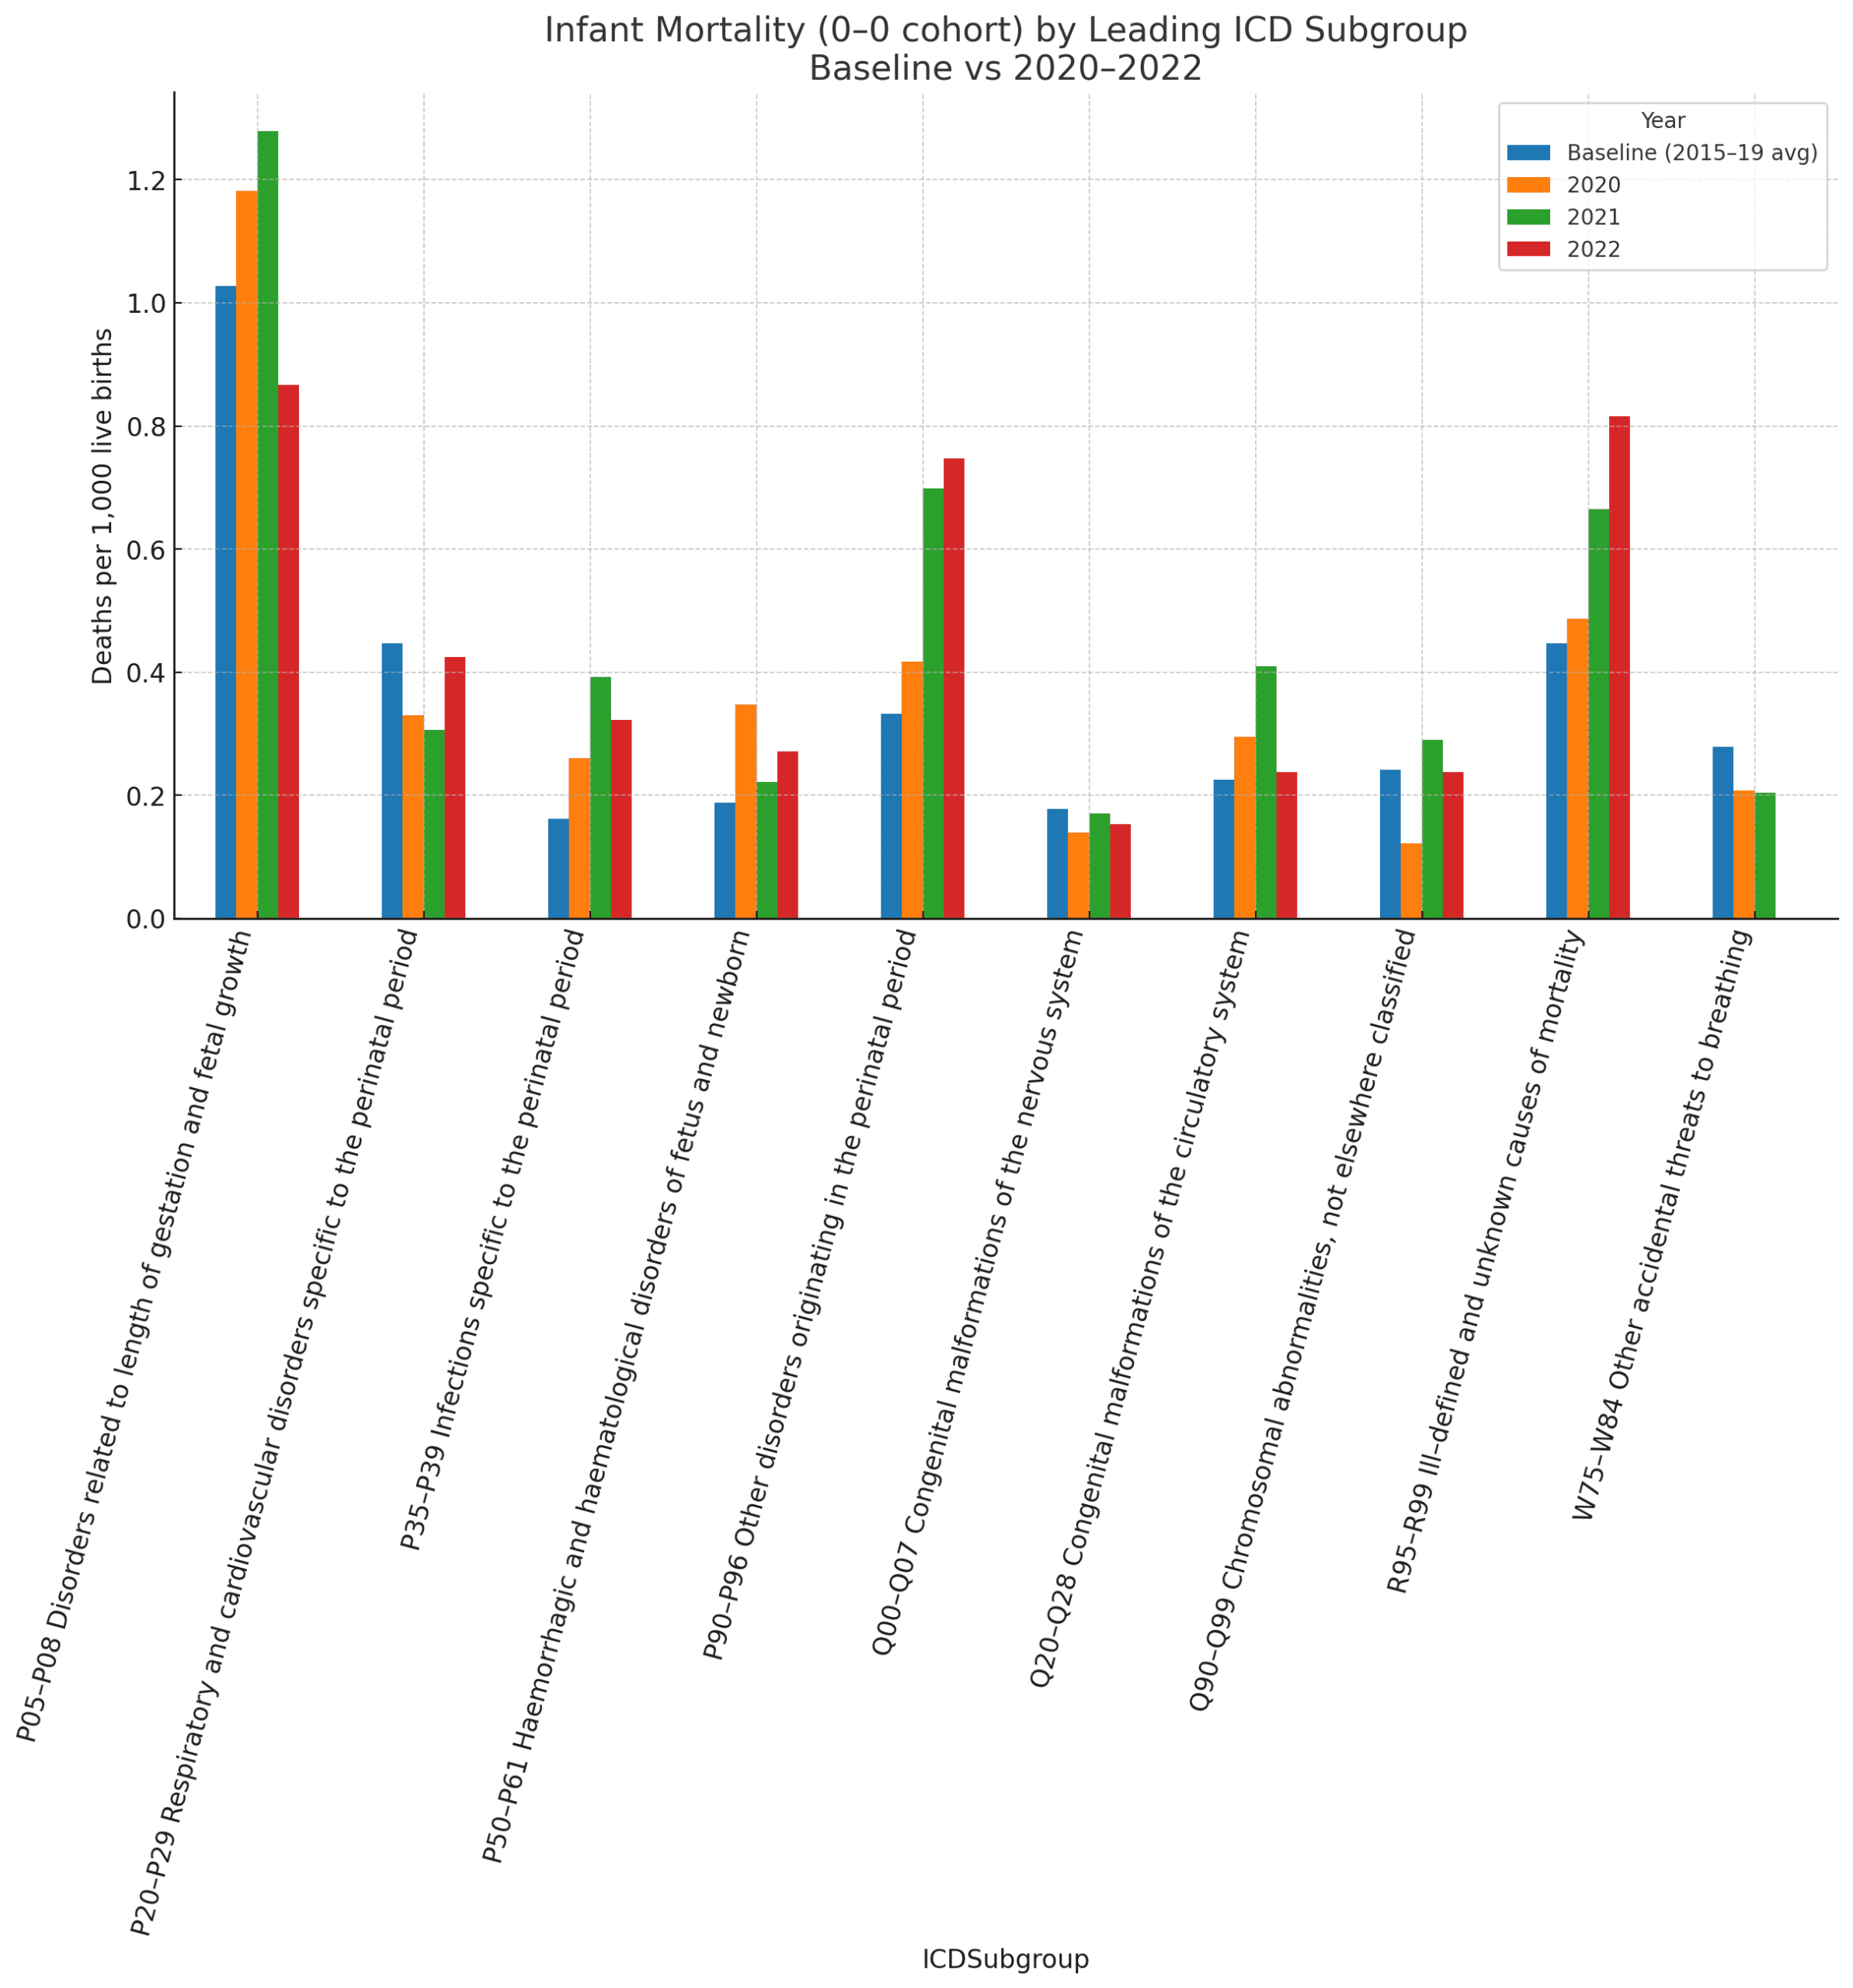
This analysis examines how the underlying causes of death for infants under one year (the 0–0 cohort) have changed in New Zealand since 2020, compared to the 2015–2019 baseline.
Establishing the Baseline
Between 2015 and 2019, the leading contributors to infant mortality were:
- Gestation and fetal growth disorders (P05–P08) – ~61 deaths per year
- Perinatal respiratory and cardiovascular disorders (P20–P29) – ~27 deaths per year
- Ill-defined and unknown causes (R95–R99) – ~27 deaths per year
- Other perinatal disorders (P90–P96) – ~20 deaths per year
- Accidental threats to breathing (W75–W84) – ~17 deaths per year
- Congenital malformations (circulatory, nervous system, chromosomal) – ~10–14 deaths per year in each category
- Perinatal infections (P35–P39) – ~10 deaths per year
- Haemorrhagic/haematological newborn disorders (P50–P61) – ~11 deaths per year
This represents the “normal” distribution of causes prior to 2020.
2020: Initial Shifts
- Gestation/fetal growth disorders rose to 68 deaths (+23% vs baseline).
- Ill-defined causes also climbed slightly (28 deaths, +5%).
- Perinatal infections increased (15 deaths, +40%).
- Respiratory/cardiovascular conditions declined to 19 deaths (–32%).
- Accidental threats to breathing also fell (–28%).
Overall, 2020 marked the beginning of a shift away from external/respiratory causes and toward gestational and perinatal conditions.
2021: Peak in Excess Causes
- Gestation/fetal growth disorders spiked to 75 deaths (+22%).
- Other perinatal disorders more than doubled to 41 deaths (+107%).
- Ill-defined causes rose to 39 deaths (+47%).
- Perinatal infections more than doubled to 23 deaths (+140%).
- Congenital circulatory malformations jumped to 24 deaths (+79%).
- Respiratory/cardiovascular disorders dropped further to 18 deaths (–32%).
- Accidental threats to breathing continued below baseline (–28%).
2021 clearly shows a concentration of excess mortality in disorders of gestation, perinatal origin, and infections.
2022: A Different Pattern
- Other perinatal disorders remained high at 44 deaths (+122%).
- Ill-defined/unknown causes surged further to 48 deaths (+81%).
- Gestation/fetal growth disorders declined to 51 deaths (–17%).
- Respiratory/cardiovascular conditions nearly returned to baseline at 25 deaths (–6%).
- Perinatal infections stayed elevated at 19 deaths (+98%).
- Haemorrhagic newborn disorders rose to 16 deaths (+43%).
- Congenital malformations (nervous system, circulatory, chromosomal) fell closer to baseline levels.
In 2022, the excess shifted away from gestation/fetal growth, concentrating instead in perinatal disorders, infections, and ill-defined causes.
Summary of Trends
- Gestation/fetal growth (P05–P08): rose in 2020–21, then fell below baseline in 2022.
- Other perinatal disorders (P90–P96): consistently and substantially higher since 2020.
- Ill-defined/unknown causes (R95–R99): sharply higher in both 2021 and 2022.
- Perinatal infections (P35–P39): markedly higher post-2020, almost double baseline.
- Respiratory/cardiovascular (P20–P29) and accidental threats (W75–W84): below baseline since 2020.
The data highlights a clear shift in the composition of infant mortality: from respiratory and accidental causes in the baseline years, toward perinatal disorders, infections, and unexplained causes in 2020–2022.
Caveat:
There is NO Chapter 20 (External Causes of Death) available for 2022, and the coroner is yet to complete 168 deaths. They could be in any of these, or all in C20, we just don’t know.
Tables – 2015-2019 Baseline, 2020, 2021, 2022
2015 – 2019 baseline (average per year)
| ICD Subgroup | Avg deaths/yr | Rate per 1,000 births |
|---|---|---|
| P05–P08 – Gestation/fetal growth disorders | 61.2 | 1.03 |
| R95–R99 – Ill-defined/unknown causes | 26.6 | 0.45 |
| P20–P29 – Perinatal respiratory & cardiovascular | 26.6 | 0.45 |
| P90–P96 – Other perinatal disorders | 19.8 | 0.33 |
| W75–W84 – Accidental threats to breathing | 16.6 | 0.28 |
| Q90–Q99 – Chromosomal abnormalities | 14.4 | 0.24 |
| Q20–Q28 – Congenital circulatory malformations | 13.4 | 0.23 |
| P50–P61 – Haemorrhagic/haematological newborn disorders | 11.2 | 0.19 |
| Q00–Q07 – Congenital nervous system malformations | 10.6 | 0.18 |
| P35–P39 – Perinatal infections | 9.6 | 0.16 |
2020 (57,573 births)
| ICD Subgroup | Deaths | Rate per 1,000 births |
|---|---|---|
| P05–P08 – Gestation/fetal growth disorders | 68 | 1.18 |
| R95–R99 – Ill-defined/unknown causes | 28 | 0.49 |
| P20–P29 – Perinatal respiratory & cardiovascular | 19 | 0.33 |
| P90–P96 – Other perinatal disorders | 24 | 0.42 |
| W75–W84 – Accidental threats to breathing | 12 | 0.21 |
| Q20–Q28 – Congenital circulatory malformations | 17 | 0.30 |
| P50–P61 – Haemorrhagic/haematological newborn disorders | 20 | 0.35 |
| P35–P39 – Perinatal infections | 15 | 0.26 |
| Q00–Q07 – Congenital nervous system malformations | 8 | 0.14 |
| Q90–Q99 – Chromosomal abnormalities | 7 | 0.12 |
2021 (58,662 births)
| ICD Subgroup | Deaths | Rate per 1,000 births |
|---|---|---|
| P05–P08 – Gestation/fetal growth disorders | 75 | 1.28 |
| R95–R99 – Ill-defined/unknown causes | 39 | 0.66 |
| P90–P96 – Other perinatal disorders | 41 | 0.70 |
| P20–P29 – Perinatal respiratory & cardiovascular | 18 | 0.31 |
| P35–P39 – Perinatal infections | 23 | 0.39 |
| Q20–Q28 – Congenital circulatory malformations | 24 | 0.41 |
| Q90–Q99 – Chromosomal abnormalities | 17 | 0.29 |
| P50–P61 – Haemorrhagic/haematological newborn disorders | 13 | 0.22 |
| Q00–Q07 – Congenital nervous system malformations | 10 | 0.17 |
| W75–W84 – Accidental threats to breathing | 12 | 0.20 |
2022 (58,884 births)
| ICD Subgroup | Deaths | Rate per 1,000 births |
|---|---|---|
| P05–P08 – Gestation/fetal growth disorders | 51 | 0.87 |
| R95–R99 – Ill-defined/unknown causes | 48 | 0.82 |
| P90–P96 – Other perinatal disorders | 44 | 0.75 |
| P20–P29 – Perinatal respiratory & cardiovascular | 25 | 0.42 |
| P35–P39 – Perinatal infections | 19 | 0.32 |
| P50–P61 – Haemorrhagic/haematological newborn disorders | 16 | 0.27 |
| Q90–Q99 – Chromosomal abnormalities | 14 | 0.24 |
| Q20–Q28 – Congenital circulatory malformations | 14 | 0.24 |
| Q00–Q07 – Congenital nervous system malformations | 9 | 0.15 |
| Q65–Q79 – Musculoskeletal malformations | 5 | 0.08 |
| Mortality Group (ICD Subgroup) | Baseline Avg (2015–19) | 2021 | 2022 | Diff 2021 | %Diff 2021 | Diff 2022 | %Diff 2022 |
|---|---|---|---|---|---|---|---|
| P05–P08 – Gestation/fetal growth disorders | 61.2 | 75 | 51 | +13.8 | +22.5% | –10.2 | –16.7% |
| P20–P29 – Perinatal respiratory & cardiovascular | 26.6 | 18 | 25 | –8.6 | –32.3% | –1.6 | –6.0% |
| P35–P39 – Perinatal infections | 9.6 | 23 | 19 | +13.4 | +140% | +9.4 | +98% |
| P50–P61 – Haemorrhagic/haematological newborn disorders | 11.2 | 13 | 16 | +1.8 | +16% | +4.8 | +43% |
| P90–P96 – Other perinatal disorders | 19.8 | 41 | 44 | +21.2 | +107% | +24.2 | +122% |
| Q00–Q07 – Congenital nervous system malformations | 10.6 | 10 | 9 | –0.6 | –6% | –1.6 | –15% |
| Q20–Q28 – Congenital circulatory malformations | 13.4 | 24 | 14 | +10.6 | +79% | +0.6 | +5% |
| Q90–Q99 – Chromosomal abnormalities | 14.4 | 17 | 14 | +2.6 | +18% | –0.4 | –3% |
| R95–R99 – Ill-defined/unknown causes | 26.6 | 39 | 48 | +12.4 | +47% | +21.4 | +81% |
| W75–W84 – Accidental threats to breathing | 16.6 | 12 | – | –4.6 | –28% | – | – |
Key shifts
2021 was the peak year: gestation/fetal growth (P05–P08) and “other perinatal” (P90–P96) both substantially higher than baseline rates.
Ill-defined causes (R95–R99) rose notably in 2021–2022.
By 2022, many categories fell closer to baseline — but the rise in “ill-defined/unknown” stands out as replacing some of the decline in other groups. (No “External Causes” data is available for this year as yet, and 168 deaths remain uncompleted by the Coroner)


