Sunday, August 31, 2025
  • Login
SCNZ
No Result
View All Result
  • Home
  • Covid

    The Psychology Behind the Rejection of Data-Based Facts That Challenge Narrative

    What the Data Shows – Cause of Death for Infant (age 0) Group in NZ 2015 -2019 vs 2020 – 2022

    What the Data Shows: NZ’s Excess Mortality in under-1 Year Olds

    What the COVID Inquiry Owes the Public of New Zealand – The Questions They Should Ask

    A Rise in Uncertainty: Ill-Defined and Perinatal Infant Deaths in New Zealand

    Rising Cancer Deaths in New Zealand’s Youngest: A Decade Review

    Narrative, Data, and the Cost of Certainty — Reviewing David Hood’s Submission

    Why I Don’t Worship at the Altar of Barry, Liz, and Steve

    Why The Stolen Data Was Useless

  • Crime

    Crime in NZ – Offending by Offence Type and Ethnicity – July 2024 – June 2025

    Family Violence in New Zealand – Violent Offending by Family Member by Ethnicity – June 2024 – May 2025

    Family Violence in New Zealand – Violent Offending by Family Member by Ethnicity – May 2024 – April 2025

    Crime in NZ – Offending by Offence Type and Ethnicity – May 2024 – April 2025

    Crime in NZ – Who are the Victims of Crime? – Victimisations March 2024 – April 2025

    Youth Offending Reducing in New Zealand?: An Analytical Review (2010–2023)

    Analyzing New Zealand’s Crime Trends: 2015-2024

    Drug Crime in New Zealand, Trend Analysis: 2015 – 2024

    Sexual Offense Charges in New Zealand: A Decade of Trends by Sex, Ethnicity, and Victim Demographics

  • Opinion

    Democracy Needs Dissent — Not AI-Generated Consensus

    Why People Need to Use Tools Correctly — Especially AI

    The Fallacy of Using Chromosomal Abnormalities as Evidence Humans Can Change Sex

    The Danger of Default Narratives: Why Core Instructions Matter When Using AI to Analyze Covid Data

    Why Age-Standardised Mortality Rates for Modelling Covid Mortality Expectations is Wrong

    A Letter to the Minister of Health about Concerning Trends vis-a-vis Vaccine Rollout and Covid Deaths

    The Problem with Counting Lives ‘Saved’

    Framing the Question: Why Most People Get AI Wrong

    Grok, Guardrails, and Gaslighting

  • Shop
  • About
PREMIUM
FREE
  • Home
  • Covid

    The Psychology Behind the Rejection of Data-Based Facts That Challenge Narrative

    What the Data Shows – Cause of Death for Infant (age 0) Group in NZ 2015 -2019 vs 2020 – 2022

    What the Data Shows: NZ’s Excess Mortality in under-1 Year Olds

    What the COVID Inquiry Owes the Public of New Zealand – The Questions They Should Ask

    A Rise in Uncertainty: Ill-Defined and Perinatal Infant Deaths in New Zealand

    Rising Cancer Deaths in New Zealand’s Youngest: A Decade Review

    Narrative, Data, and the Cost of Certainty — Reviewing David Hood’s Submission

    Why I Don’t Worship at the Altar of Barry, Liz, and Steve

    Why The Stolen Data Was Useless

  • Crime

    Crime in NZ – Offending by Offence Type and Ethnicity – July 2024 – June 2025

    Family Violence in New Zealand – Violent Offending by Family Member by Ethnicity – June 2024 – May 2025

    Family Violence in New Zealand – Violent Offending by Family Member by Ethnicity – May 2024 – April 2025

    Crime in NZ – Offending by Offence Type and Ethnicity – May 2024 – April 2025

    Crime in NZ – Who are the Victims of Crime? – Victimisations March 2024 – April 2025

    Youth Offending Reducing in New Zealand?: An Analytical Review (2010–2023)

    Analyzing New Zealand’s Crime Trends: 2015-2024

    Drug Crime in New Zealand, Trend Analysis: 2015 – 2024

    Sexual Offense Charges in New Zealand: A Decade of Trends by Sex, Ethnicity, and Victim Demographics

  • Opinion

    Democracy Needs Dissent — Not AI-Generated Consensus

    Why People Need to Use Tools Correctly — Especially AI

    The Fallacy of Using Chromosomal Abnormalities as Evidence Humans Can Change Sex

    The Danger of Default Narratives: Why Core Instructions Matter When Using AI to Analyze Covid Data

    Why Age-Standardised Mortality Rates for Modelling Covid Mortality Expectations is Wrong

    A Letter to the Minister of Health about Concerning Trends vis-a-vis Vaccine Rollout and Covid Deaths

    The Problem with Counting Lives ‘Saved’

    Framing the Question: Why Most People Get AI Wrong

    Grok, Guardrails, and Gaslighting

  • Shop
  • About
No Result
View All Result
SCNZ
No Result
View All Result
Home Covid

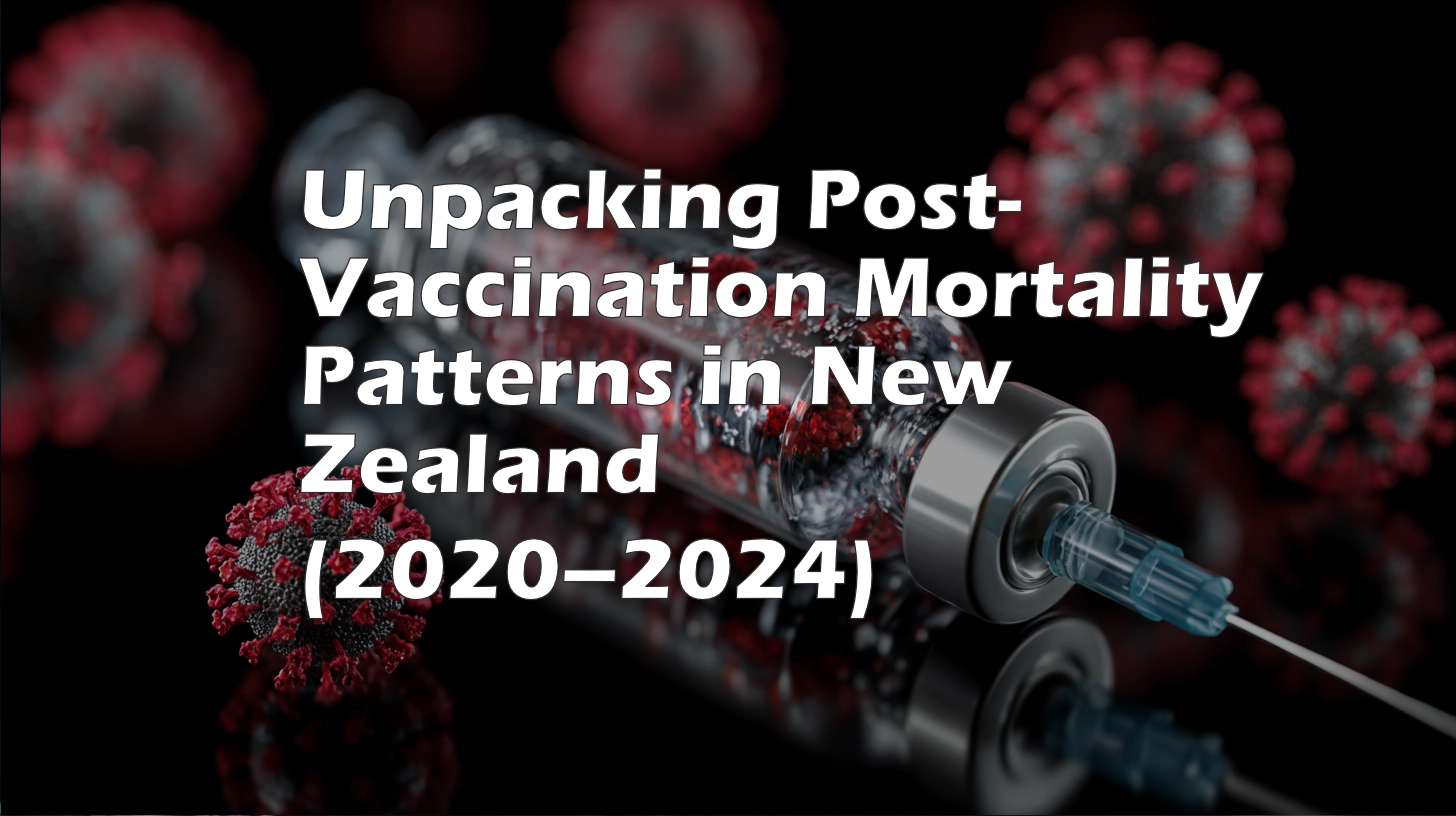
Unpacking Post-Vaccination Mortality Patterns in New Zealand (2020–2024)

SpiderCatNZ<span class="bp-verified-badge"></span> by SpiderCatNZ
June 26, 2025
in Covid
Reading Time: 4 mins read
A A
0
5
SHARES
243
VIEWS
Share on FacebookShare on TwitterEmail

Table of Contents

🧭 Overview

As New Zealand navigated the COVID-19 pandemic, over 11 million doses of COVID-19 vaccines were administered to a population of around 5 million. This analysis investigates the patterns of all-cause mortality in the weeks and months following vaccination, focusing on age-stratified data from the New Zealand Ministry of Health.

RELATED POSTS

The Psychology Behind the Rejection of Data-Based Facts That Challenge Narrative

What the Data Shows – Cause of Death for Infant (age 0) Group in NZ 2015 -2019 vs 2020 – 2022

What the Data Shows: NZ’s Excess Mortality in under-1 Year Olds

The findings aim to contribute to a deeper understanding of how timing and demographic context might affect mortality statistics, without jumping to conclusions about causality.


📊 Key Findings

1. Sharp Mortality Peaks Shortly After Vaccination

Using anonymized data of deaths following the last recorded vaccine dose, we observe:

  • A distinct spike in deaths in the first 0–7 days following vaccination, across nearly all doses.
  • The spike is particularly noticeable after Doses 1 and 2, which had the highest number of recipients.
  • Doses 3 to 5 show persistent elevated death counts into the 8–30 and 31–90 day windows, especially among the elderly.

2. Mortality Concentrated in the 80+ Age Group

When filtering the data to include only people aged 30 and over:

  • The 80+ age group dominates short-term mortality following vaccination.
    • Over 600 deaths occurred within 0–7 days in this group alone.
    • Thousands more were recorded within the 30–180 day post-vaccination period.
  • This pattern is consistent with vaccination programs targeting frail and elderly individuals, often in aged-care facilities.

3. Younger Adults (30–64) Showed Relatively Low Mortality

  • In comparison, people aged 30–64 showed significantly fewer deaths post-vaccination.
    • Fewer than 100 deaths occurred within 0–7 days across all doses in this group.

4. Normalized Death Rates Confirm Real Differences

  • When deaths are adjusted for the size of the vaccinated population, Doses 1 and 2 still show the highest short-term death rates per 100,000 recipients.
  • Doses 3 to 5 remain elevated, but are more drawn out over time—again suggesting administration to populations with limited life expectancy.

5. Excess Mortality Trends Track with Booster Campaigns

  • By comparing weekly excess deaths (deaths above the normal baseline) with vaccine rollout data, we find:
    • Noticeable overlaps between the peak of vaccination waves and surges in excess deaths.
    • This alignment appears most clear during the third and fourth dose rollout phases.

🧠 Key Takeaways

  • Temporal proximity to vaccination does not necessarily imply causation, especially in elderly or terminally ill populations who were prioritized for early and repeated vaccination.
  • The clustering of deaths shortly after vaccination is most prominent in those already at high risk of mortality.
  • Monitoring and transparency of such data are essential to maintain trust and improve future public health interventions.

🔮 Next Steps

To build on these insights, we suggest:

  1. Normalize deaths per dose group by population age strata, improving accuracy in risk comparisons.
  2. Visualize heatmaps showing how mortality patterns evolve by age and time post-vaccination.
  3. Segment deaths by facility type, if data becomes available (e.g., aged-care vs. community).
  4. Adjust excess mortality estimates by subtracting direct COVID-19 deaths, revealing unexplained surpluses.
  5. Perform time-shifted statistical analysis (e.g., Granger causality) to better understand temporal patterns.

Some of these next steps can be found in the next article in this series: Statistical Relationships – Covid Vaccine Doses and Deaths in NZ from 2020 through early 2025


Become a Member Become a Member
ADVERTISEMENT

Hey! 👋
It’s great to see you're reading this.

Sign up to receive notification via email, when we post new articles

We don’t spam! Read our privacy policy for more info.

Check your inbox or spam folder to confirm your subscription.

Please Share:
Tags: covidstatsvaccinationvaccine
Share2Tweet1Send
Previous Post

Data Fudgery or Stats Oddities? Early-mid July 2022

Next Post

Is a New Booster Really the Best Protection? What does the HNZ data say?

SpiderCatNZ<span class="bp-verified-badge"></span>

SpiderCatNZ

Iiiiiiiiiiit's me!

Related Posts

Covid

The Psychology Behind the Rejection of Data-Based Facts That Challenge Narrative

by SpiderCatNZ
August 22, 2025
0

In the realm of public discourse around COVID-19, vaccination, and mortality, few things are as revealing as the reaction to...

Covid

What the Data Shows – Cause of Death for Infant (age 0) Group in NZ 2015 -2019 vs 2020 – 2022

by SpiderCatNZ
August 22, 2025
0

Shifts in Causes of Infant Mortality in New Zealand (0–0 cohort) This analysis examines how the underlying causes of death...

What the Data Shows: NZ’s Excess Mortality in under-1 Year Olds

August 22, 2025

What the COVID Inquiry Owes the Public of New Zealand – The Questions They Should Ask

August 17, 2025

A Rise in Uncertainty: Ill-Defined and Perinatal Infant Deaths in New Zealand

August 19, 2025

Rising Cancer Deaths in New Zealand’s Youngest: A Decade Review

August 19, 2025
Next Post

Is a New Booster Really the Best Protection? What does the HNZ data say?

How Will NZ's Excess Mortality look in 10 Years if we Keep Boosting?

Please login to join discussion

Lost your password?

ai (5) anti-vaxxer (1) cancer (1) censorship (2) chatgpt (1) cindy (1) covid (42) crime (19) drugs (1) ethnicity (1) excess (1) excess mortality (1) guardrails (1) haitian bbq (1) infant (1) infant mortality (1) liz gunn (1) madness (1) Meltdown (5) MOAR (1) monkeypox (2) mortality (7) oia (1) per-capita (16) psychology (1) racism (1) server (1) side-effects (1) starlink (1) stats (45) terf (1) transmad (1) us politics (1) vaccination (23) vaccine (8) violent crime (1) whistleblower (1) woman (3)

Latest Products

  • SCNZ 2025 Can cooler SCNZ 2025 Can cooler $8.00
  • SCNZ 2025 Gaming mouse pad SCNZ 2025 Gaming mouse pad $25.00 – $43.00Price range: $25.00 through $43.00
  • SCNZ Platinum Tier SCNZ Platinum Tier $50.00
  • SCNZ Premium Tier SCNZ Premium Tier $10.00
  • SCNZ Ads-Free Tier SCNZ Ads-Free Tier $5.00

Categories

  • Covid (55)
  • Crime (25)
  • News (6)
  • Opinion (44)
  • Premium Content (3)
  • Spider Cat NZ (8)
    • MidJourney (2)
  • Uncategorized (6)

Recent Posts

  • The Psychology Behind the Rejection of Data-Based Facts That Challenge Narrative
  • What the Data Shows – Cause of Death for Infant (age 0) Group in NZ 2015 -2019 vs 2020 – 2022
  • What the Data Shows: NZ’s Excess Mortality in under-1 Year Olds

Categories

  • Covid
  • Crime
  • MidJourney
  • News
  • Opinion
  • Premium Content
  • Spider Cat NZ
  • Uncategorized

“If they take the vaccine, they'll still get Covid, it just means they won't get sick and they won't die.”

— Jacinda Ardern

© 2023 - 2025 Spider Cat NZ.

Welcome Back!

Login to your account below

Forgotten Password?

Retrieve your password

Please enter your username or email address to reset your password.

Log In
No Result
View All Result
  • Home
  • Covid
  • Crime
  • Log In
  • Register
  • Login
  • Cart

© 2023 - 2025 Spider Cat NZ.

Are you sure want to unlock this post?
Unlock left : 0
Are you sure want to cancel subscription?