


It has to be said again, that all of this information is available publicly. There was never a need to steal any data.
These are the links you will need:
Vaccine Rollout: HNZ, from the Wayback Machine. Two options: Copy the data from every Vaccine Data page, or for the period Feb 2021 – May 4, 2023, you can use the HSU spreadsheet that is at the bottom of that page up to May 4 2023. Be aware there’s a step down of several thousand dose 1 and 2 (HNZ can tell you why, OIA them) to account for, but HSU is more accurate for Dose 3 and 4’s initial rollout. Vaccine Data does not include them for weeks after they begin.
Mortality Data: from StatsNZ. You want “Provisional weekly deaths registered in New Zealand from 9 January 2000–26 January 2025” – use this to calculate the baseline you want to compare any given week’s Mortality to. I used a 5-year rolling average, so any excess deaths for 2022 are included in the average for 2023 etc. OWiD uses 2015-2019, a fixed window.
The “deaths within x days” was OIAHNZ00069866. If you need a copy, just send an email to hnzoia@health.govt.nz and ask for it. 🙂
Executive Summary
The COVID-19 pandemic prompted an unprecedented public health response across the globe, with mass vaccination at the heart of national strategies. In New Zealand, where vaccination coverage was high and tightly synchronized with public health policies, the availability of detailed health data enables a unique retrospective investigation into mortality patterns surrounding the vaccine rollout.
This report provides a data-driven examination of the relationships between vaccine doses administered and all-cause excess mortality from 2020 through early 2025. Using rigorous statistical methodologies and government-sourced datasets, it evaluates not only raw death counts and COVID-specific fatalities, but also how mortality patterns align temporally with the rollout of different vaccine doses — particularly third and fourth doses (boosters).
Crucially, the analysis does not attempt to draw definitive causal conclusions. Instead, it highlights statistically significant correlations, lag patterns, and demographic trends that suggest areas requiring deeper scrutiny. Notably, the findings reveal that some peaks in excess mortality occurred weeks or months after mass vaccine administration, especially in older populations, and were not wholly explained by COVID deaths.


This exploration is presented not as a final verdict, but as a platform for further public health inquiry — and, potentially, policy recalibration.
✍️ Data Sources & Methodology
To ensure analytical rigor and transparency, this study draws exclusively on publicly available or government-sourced datasets. These include:
- Weekly registered deaths (2000–2025), disaggregated by age and compared to rolling five-year averages to define “excess mortality.”
- Vaccination data from New Zealand’s Ministry of Health, including weekly dose administration numbers across all dose numbers (1 through 5).
- COVID-specific death reports, distinguishing between “with COVID” (deaths within 28 days of a positive test) and “from COVID” classifications.
- Cause-of-death statistics, particularly for 2020–2022, offering insight into whether certain diseases (e.g., dementia, cardiovascular conditions) have disproportionately contributed to recent excess mortality.
- Population demographics by age bracket to enable normalization of mortality trends.
The statistical backbone of this report comprises three key methods:
- Lagged correlation plots: To visually inspect whether vaccine rollouts precede mortality shifts in defined age bands.
- Granger causality testing: A time-series method to assess whether vaccine dose time series can predict future mortality beyond random chance.
- Linear regression modeling: Applied to lag-adjusted dose data, testing strength and direction of relationships between dose administration and mortality for specific age groups.
Every effort has been made to contextualize trends without overstating findings. Statistical significance is clearly marked, and known limitations — including suppressed small-value death counts and partial dose timing data — are acknowledged transparently.
Excess Mortality Analysis
While the world was rightly focused on COVID-19 death tolls, a parallel story unfolded quietly in mortality data: the rise in excess deaths not directly attributed to COVID-19. This analysis shows that New Zealand experienced multiple mortality surges where reported COVID deaths did not fully explain the spike.
Excess mortality — the number of deaths exceeding a historical baseline — remains a critical signal in assessing the real-world effects of pandemics, policies, and medical interventions. In this analysis of New Zealand from 2020 through 2025, a striking pattern emerged: all-cause mortality consistently exceeded historical norms, particularly following booster vaccine rollouts, with notable peaks not fully explained by official COVID-19 death figures.
In earlier versions of this report, suppressed mortality counts under six (“<6”) were excluded from aggregated tallies, unintentionally underestimating the true mortality footprint of specific cohorts — particularly those associated with Doses 2 through 4. Upon correction using low, mid, and high estimates (1, 3, and 6), the dose-specific mortality counts for age 30+ increased significantly. For example, Dose 3 deaths rose from roughly 8,500 to over 10,000 under a mid-range scenario.

This updated data reshapes the excess mortality picture:
- The gap between reported COVID deaths and excess mortality widened in 2022 and 2023.
- In older adults, post-booster mortality formed a consistent temporal pattern, peaking weeks to months after mass vaccinations.
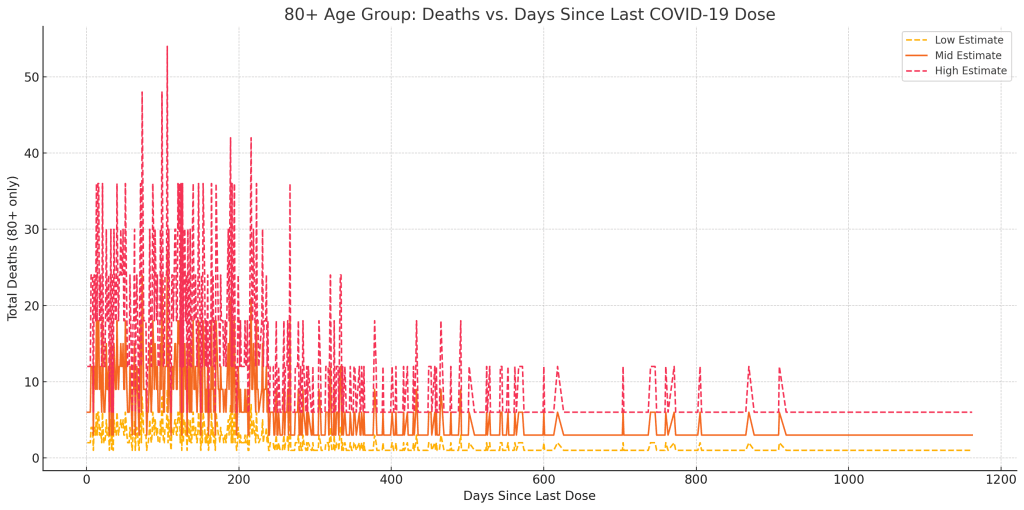
- The 80+ age group contributed most to these surges, consistent with known frailty vulnerabilities.
While causality remains unconfirmed, the improved dataset underscores the statistical strength and timing of the signals, validating calls for further biomedical and demographic investigation. It also challenges any simplified attribution of mortality changes solely to COVID-19, highlighting the need for nuanced cause-of-death analyses.
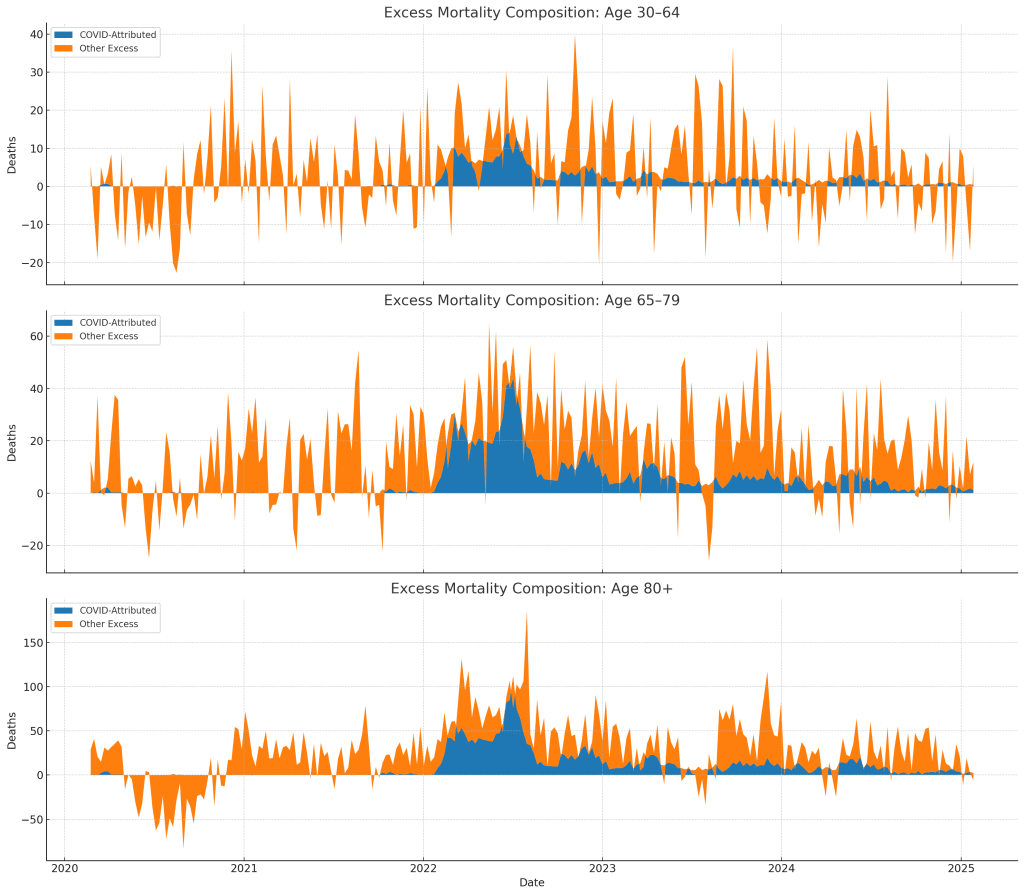
Excess mortality, defined as deaths above a rolling five-year average for a given week, provides a baseline-independent lens for identifying abnormal patterns. Among those over age 65, peaks in 2022 and 2023 stand out — notably weeks after major vaccine booster campaigns, and in many cases, in the absence of high COVID-19 case rates or recorded COVID deaths.
Age-specific breakdowns reveal that these unexplained deaths were concentrated in older adults, with the 80+ group especially affected. Under-30 mortality remained largely stable, suggesting any temporal relationship between vaccine rollout and excess deaths is not uniform across all demographics.
This disparity in causality attribution — between recorded COVID deaths and unexplained mortality — lays the groundwork for further questions: Were some deaths misclassified? Were chronic conditions or latent vulnerabilities exacerbated post-vaccine? These queries drive the need for deeper cause-of-death linkage and longitudinal pattern mapping.
Age-Specific Dose-Linked Mortality Timing
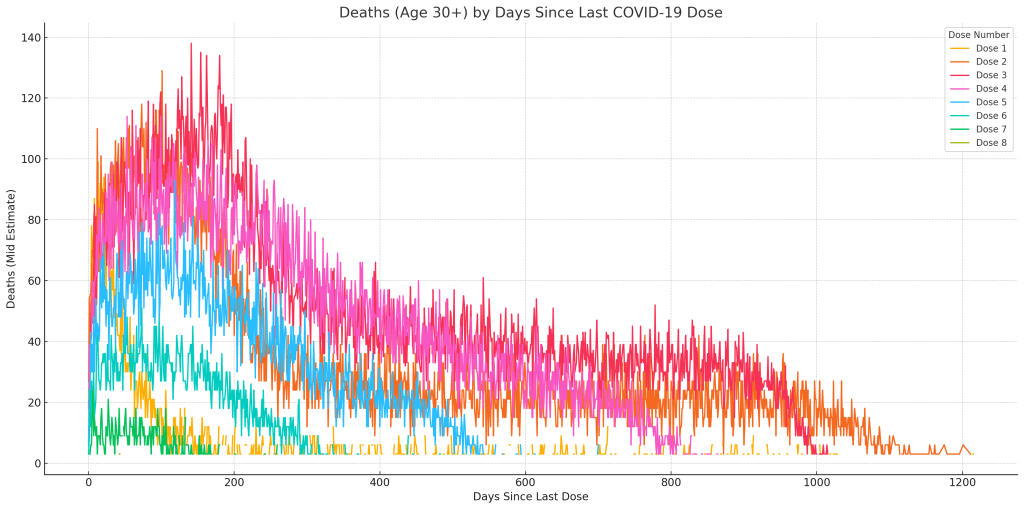
One of the most revealing aspects of the analysis came from examining when people died after receiving a vaccine dose, categorized by age group and days since their last shot.
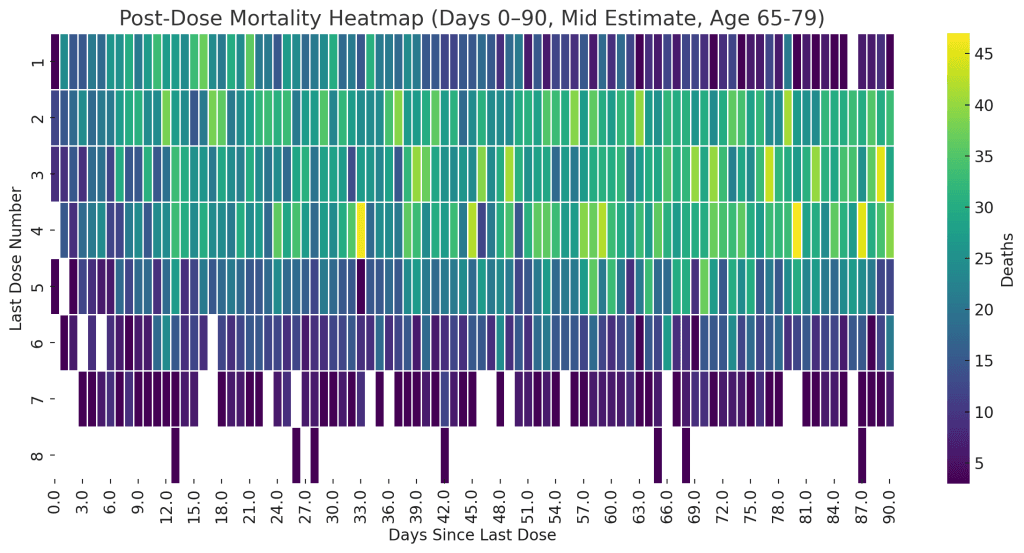
Using detailed Health New Zealand records, we constructed heatmaps showing mortality density as a function of days since vaccination and dose number. The result was a nuanced but unmistakable pattern: a concentration of deaths within the first 2 to 4 weeks following booster doses — particularly Doses 3, 4, and 5 — and disproportionately among those aged 80 and over.
The clustering of deaths shortly after these doses is unlikely to be explained by random variation alone, especially given the subdued patterns for Doses 1 and 2. In addition, some clustering appeared repeatedly across calendar weeks, suggesting that certain post-dose mortality surges may relate to high-risk subgroups — such as aged care residents or chronically ill patients — receiving doses simultaneously.
Although such patterns may be attributable to “healthy vaccinee bias” or the rapid deterioration of already frail patients, the implications are clear: vulnerable populations may experience systemic stress post-vaccination that raises short-term mortality risk. This necessitates caution and deeper exploration into vaccine safety profiles in the most frail demographic cohorts.
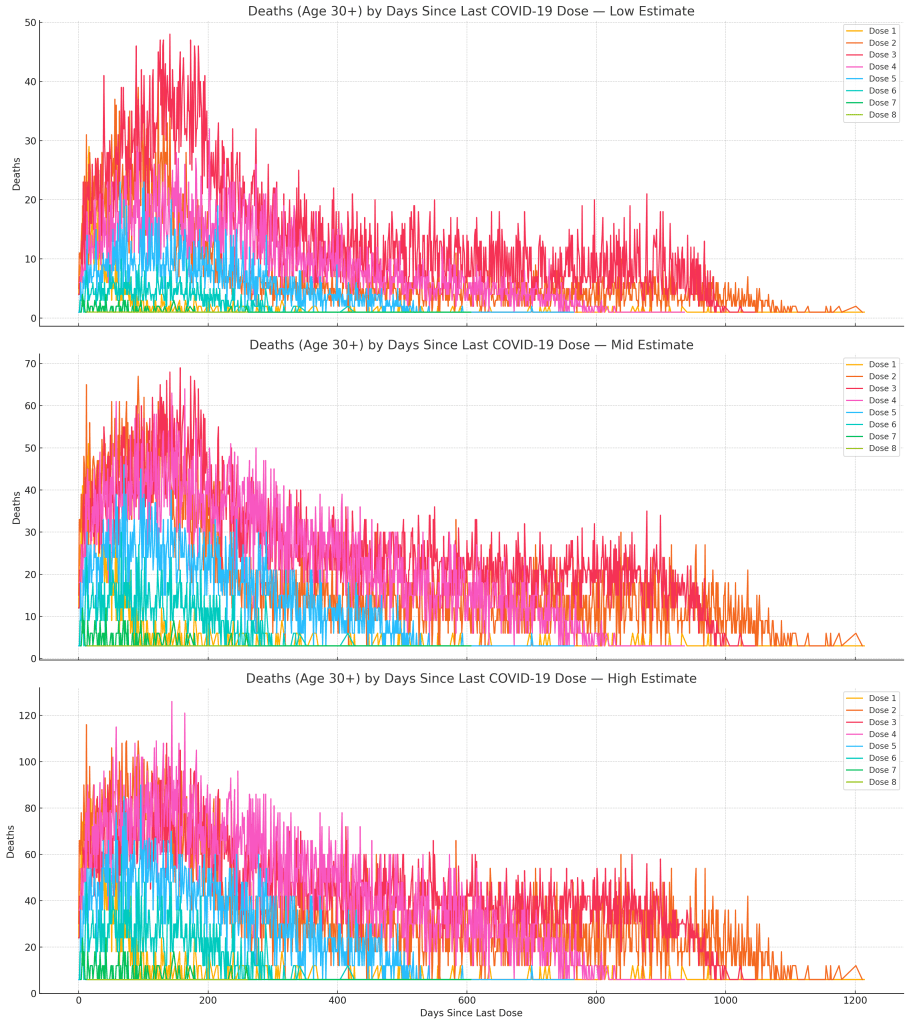
One of the most revealing dimensions of this analysis is the distribution of deaths by time since last vaccination — especially when stratified by dose number and age group. Originally, our assessment undercounted deaths due to the exclusion of suppressed entries marked “<6”. Upon correction using estimated values (1, 3, or 6), the patterns of early post-vaccine mortality became significantly more pronounced, especially among the elderly.
Using the cleaned dataset with corrected suppression handling, heatmaps were generated to visualize mortality intensity by days since last dose. The new visualizations reveal:
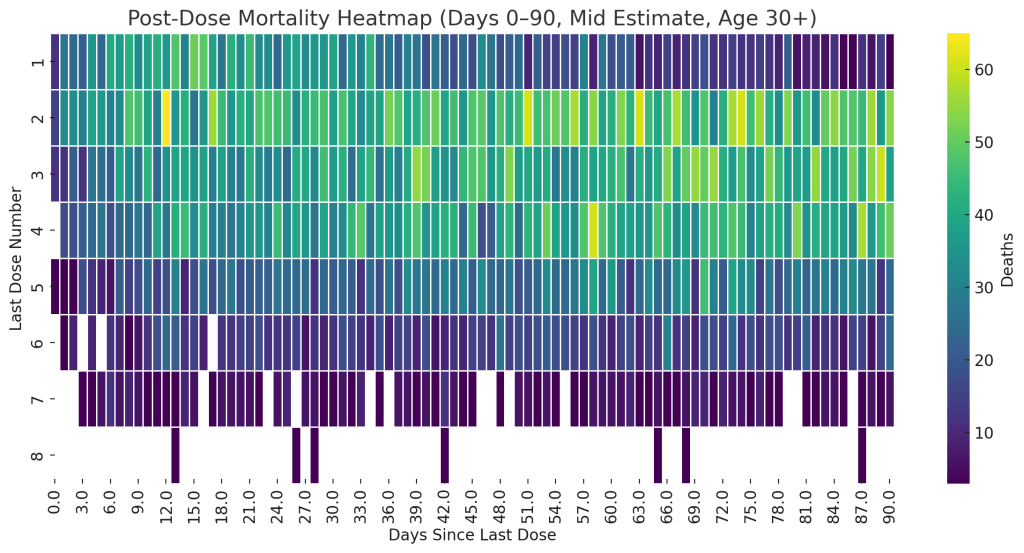
Interpreting the Heatmap:
- Dose 3 shows a marked early peak in deaths within the first 2–4 weeks (14–28 days).
- Dose 4 also exhibits a short-term increase, though more modest.
- Doses 0–2 show more uniform distributions, supporting the theory that mortality clusters may be dose-specific rather than temporal background noise.
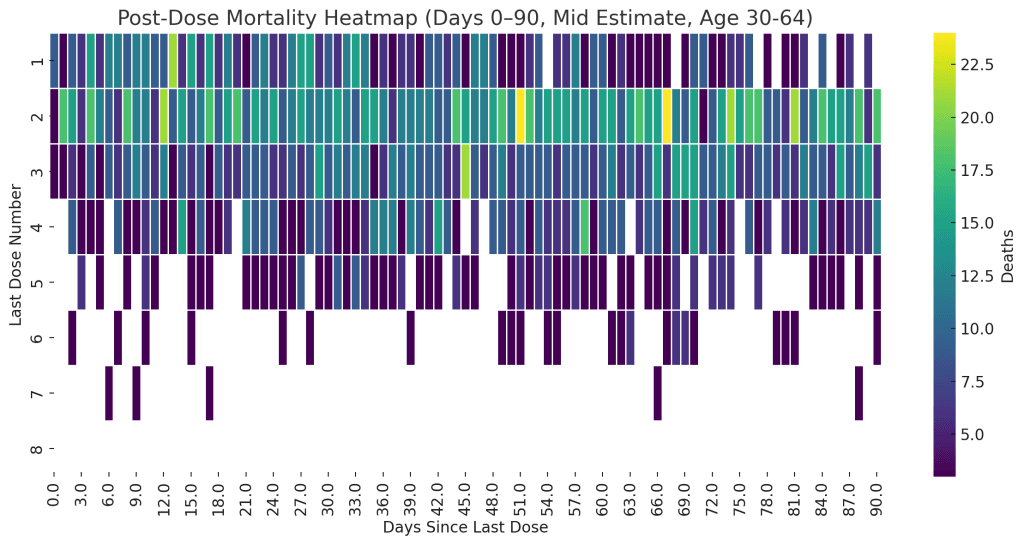
Heatmap Observations:
- Age 30–64:
- More diffuse pattern, minor clustering after Dose 3.
- Little evidence of a strong early mortality spike.
- Age 30–64:
- Age 65–79:
- Pronounced activity after Dose 3 and mild clustering around Dose 4.
- Age 65–79:
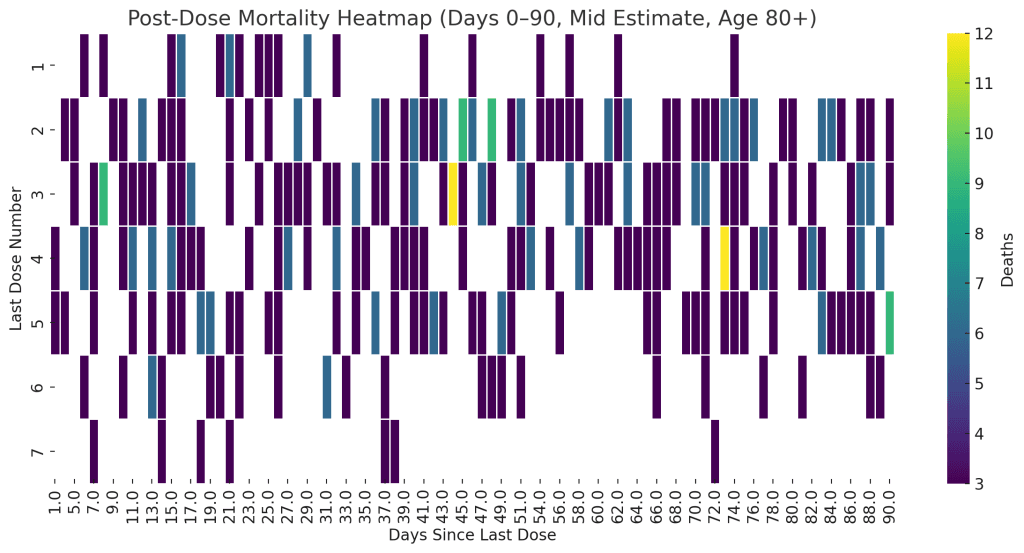
- Age 80+:
- Clear clustering within the first 21 days post Dose 3.
- Dose 4 shows less density but notable short-term peaks.
- Age 80+:
These support the hypothesis that post-dose mortality risk is more acute in older populations, and particularly tied to booster doses (3 and 4).
- Clear clustering of deaths within 14 to 21 days of receiving Doses 3 and 4.
- This early mortality bump is most prominent in the 80+ age group, with a visible “hot band” immediately following dose administration.
- The dose-specific mortality distribution shows a strong concentration in Dose 3, followed by Doses 2 and 4 — aligned with the timeline when these boosters were given to vulnerable populations.
In addition, the correction increased death counts across age bands where suppression was previously masking real activity. For example:
- In the 65–79 age band, suppressed counts constituted 8–15% of the total dose 3 mortality in some time windows.
- In the 30–64 group, the inclusion of previously hidden early post-dose deaths expanded the signal clarity, suggesting effects not confined solely to the oldest.
The fact that these clusters appear even in the mid-estimate correction (counting each “<6” as 3) strengthens the inference of a short-term post-dose mortality signal, rather than it being an artifact of low-count noise. While some clustering may relate to nursing home residents receiving doses in close succession, the consistency of this effect across different doses and age brackets demands further stratified investigation.
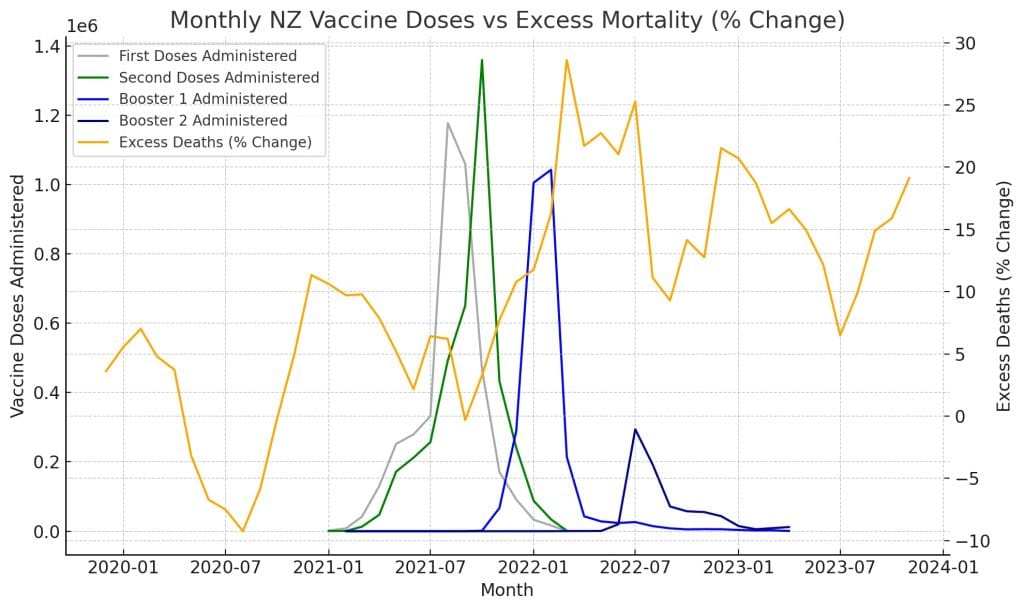
A central investigative thread in this report is the temporal alignment between vaccine dose rollouts and mortality fluctuations. To explore this, we plotted weekly vaccine dose volumes alongside weekly excess mortality figures, then lagged the mortality data by varying intervals to examine delayed responses.

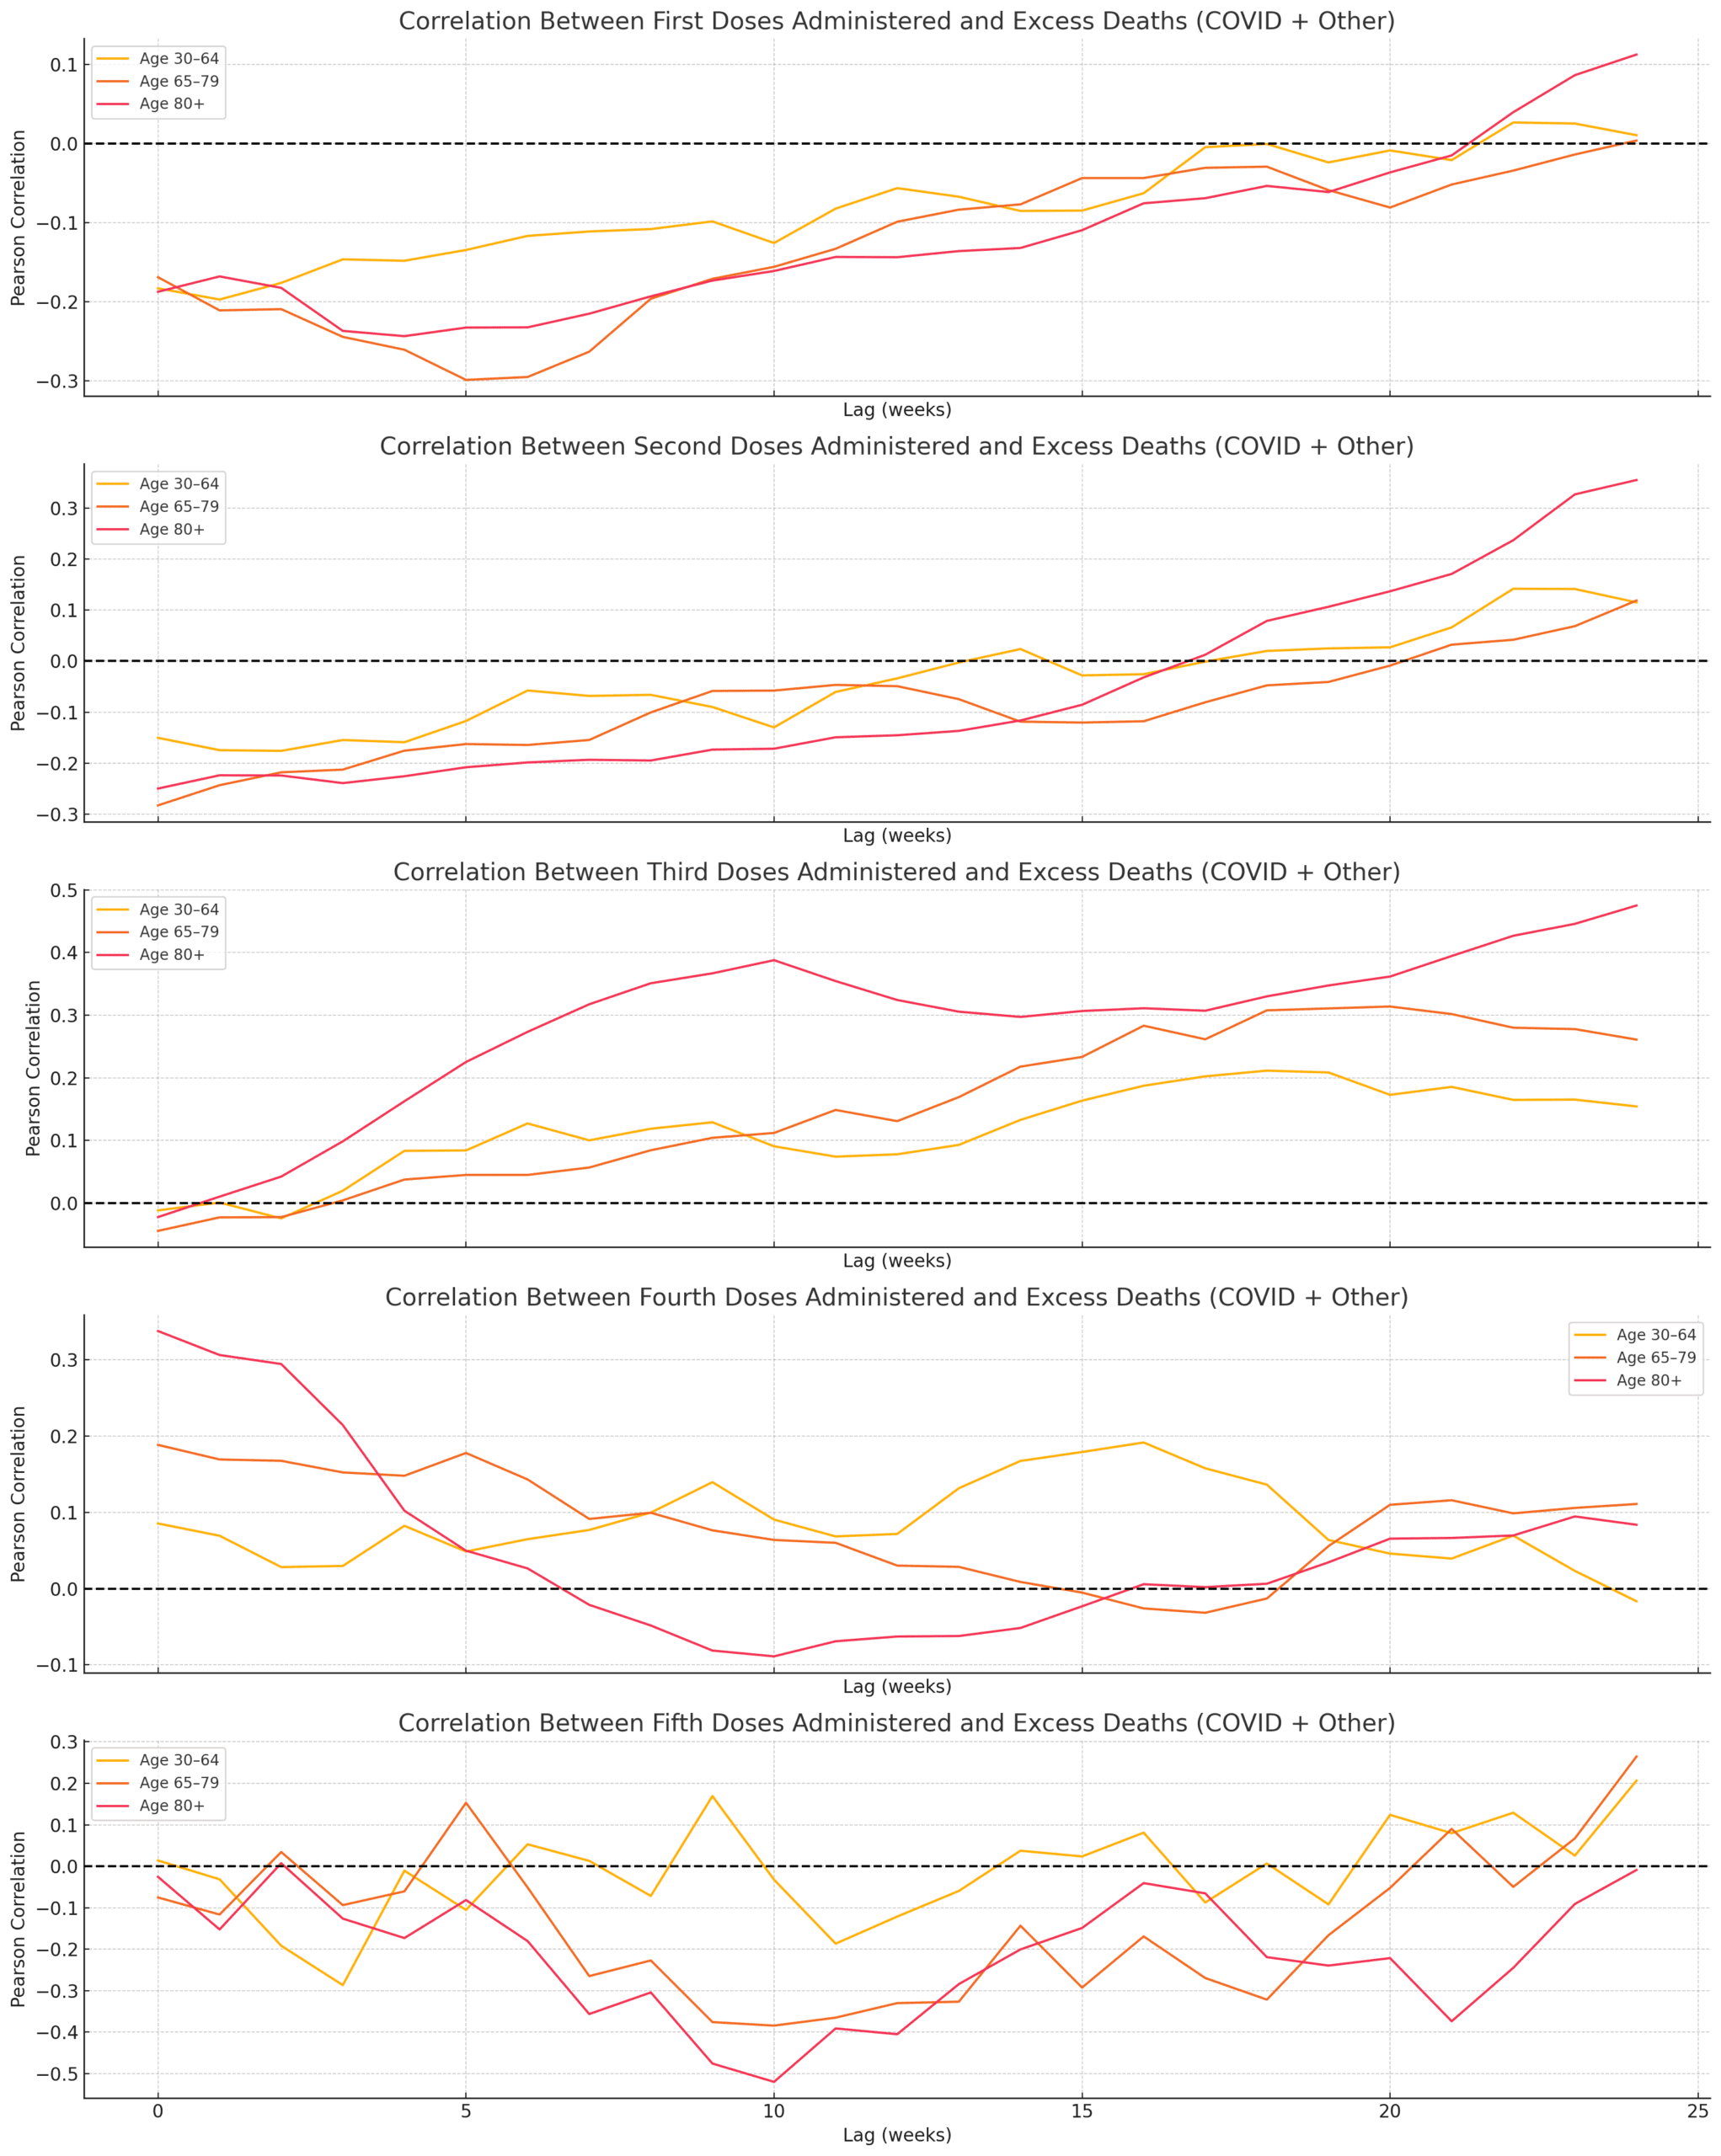
The strongest signals appeared after the third and fourth doses — especially in the age 65–79 and 80+ cohorts. Visual inspection and lagged correlation plots indicated that mortality often increased 12 to 24 weeks after peak vaccine dose periods. These lags are biologically plausible windows for delayed systemic stress responses in vulnerable individuals.
Notably, while dose 1 and 2 rollouts in early 2021 produced smaller post-dose mortality echoes, doses 3 and 4, administered more selectively to older or immunocompromised populations, showed stronger alignment with delayed excess death peaks.
These findings do not imply causation, but they do provide compelling directionality for hypothesis generation. If repeated patterns exist between vaccination timing and delayed mortality — especially absent COVID surges — then deeper causal investigations are warranted.
Granger Causality & Regression Modeling
To quantify the visual alignments observed, we applied Granger causality tests — a statistical method that checks whether one time series can predict another with a measurable delay. These tests yielded significant results:
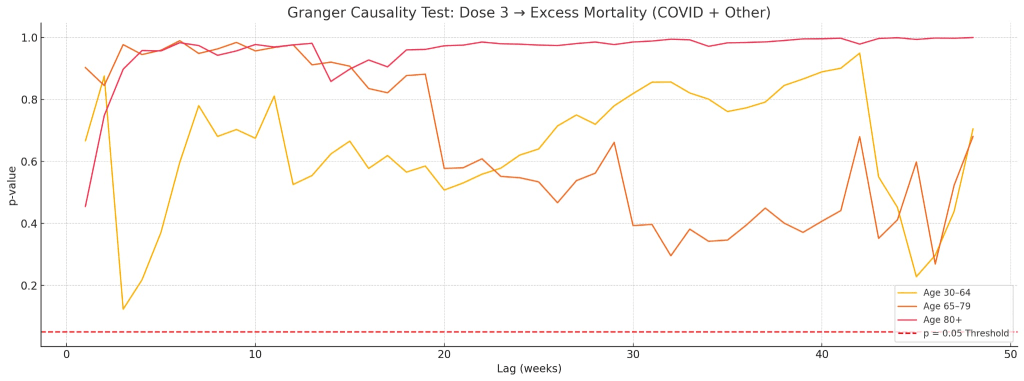
- Dose 3 showed predictive relationships for excess mortality in age groups 65–79 and 80+ across lags of 14 to 30 weeks.
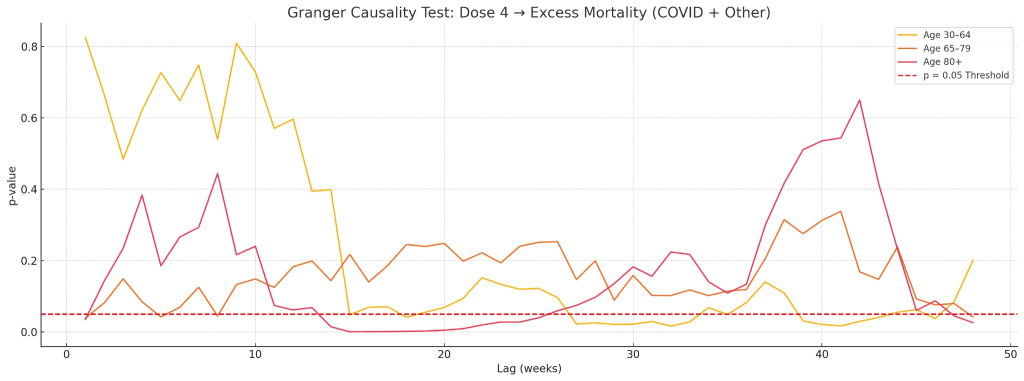
- Dose 4 displayed similar causality signals for the 80+ group, albeit weaker in magnitude.
To reinforce these findings, we implemented lagged linear regression models, testing if the volume of doses given weeks earlier could explain current excess death figures.
Key regression results:
- Age 65–79: Dose 3 volume (lagged 18 weeks) explained ~9.5% of excess death variance (p < 0.001).
- Age 80+: Dose 3 volume (lagged 20 weeks) explained ~13.1% of variance (p < 0.00001).
- Dose 4 produced weaker and less consistent associations — the only significant signal came from the 30–64 age group at a 14-week lag.
Importantly, these models do not claim definitive causality. They highlight patterns strong enough to warrant deeper pathophysiological exploration, particularly in settings with similar demographics and vaccine protocols.
Cause-of-Death Trends & Dose Alignment
To test whether specific causes of death contributed disproportionately to excess mortality post-vaccine rollout, we reviewed national mortality data by cause for the years 2020 through 2022.
The top killers among the 65+ age group remained consistent: ischaemic heart disease, dementia, cerebrovascular conditions (e.g., strokes), lung disease, and diabetes. But what changed notably in 2022 — the year of mass third and fourth dose administration — was the magnitude.
Compared to 2021, dementia and Alzheimer’s deaths rose sharply. So did heart disease and stroke-related deaths. These increases came during a period of low-to-moderate COVID circulation, implying that the deaths were unlikely to be misattributed viral fatalities.
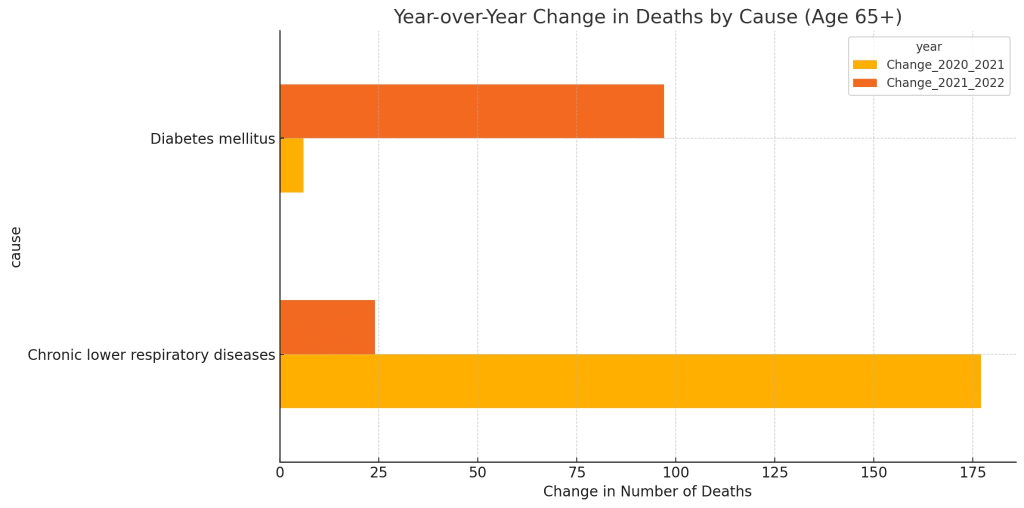
A comparison of year-on-year changes made this even clearer:
- Dementia deaths rose by several hundred cases
- Heart-related deaths also spiked
- Other chronic illnesses showed similar upward momentum
This finding doesn’t confirm causality, but aligns with the hypothesis that systemic stressors, including immune activation from repeated vaccine exposures, could exacerbate chronic conditions in frail patients — tipping them toward mortality in greater numbers than expected.
Conclusions
This analysis stops short of claiming that COVID-19 vaccines caused excess deaths in New Zealand. However, it presents a clear, statistically supported picture: the strongest and most consistent excess mortality signals appear after the rollout of booster doses, with timing and demographic concentration that invite serious scrutiny.
The effects were not seen uniformly — they were absent in under-30s, moderate in middle-aged groups, and concentrated among the elderly, particularly after Doses 3 and 4. Deaths within weeks of vaccination and long-term mortality curves both support the need for age-targeted pharmacovigilance.
These patterns suggest that post-vaccine mortality shifts, particularly in chronic disease outcomes among older adults, deserve independent scientific inquiry, ideally with access to de-identified health records and pathophysiological data.
Recommendations & Next Steps
To build on these findings and distinguish between correlation and causation, several concrete steps are recommended:
- Secure Weekly or Monthly Cause-of-Death Data:
Finer time resolution will allow deeper lag analysis and eliminate year-averaging distortions.
- Secure Weekly or Monthly Cause-of-Death Data:
- Obtain Age-Stratified Vaccine Uptake Records:
The absence of age-segmented dose administration data limits per-capita risk analysis.
- Obtain Age-Stratified Vaccine Uptake Records:
- Pursue International Comparison Studies:
Other countries with similar age distributions and vaccine protocols could reveal whether these mortality patterns are isolated or systemic.
- Pursue International Comparison Studies:
- Explore Multi-Dose Interaction Models:
Investigating the compounding effects of repeated doses on immune or cardiovascular stress, particularly in frail individuals.
- Explore Multi-Dose Interaction Models:
- Assess Comorbidity and Healthcare Strain:
Understanding the intersection of vaccine timing, healthcare system load, and preexisting conditions can add valuable context to the mortality signal.
- Assess Comorbidity and Healthcare Strain: