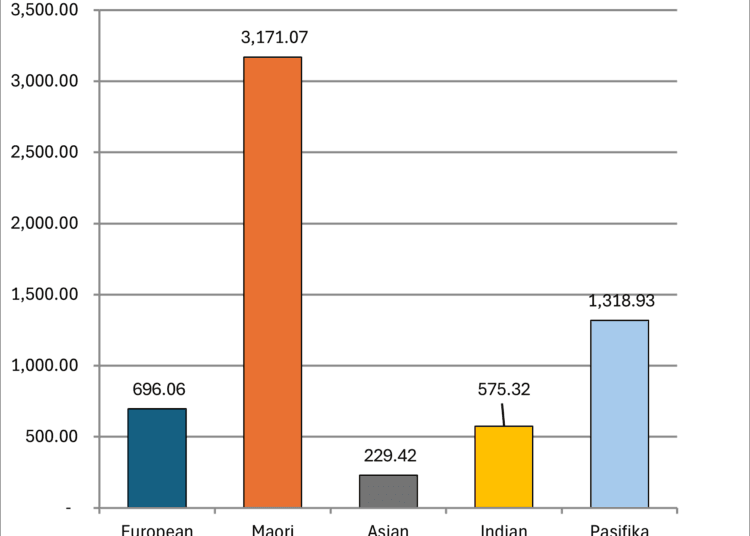


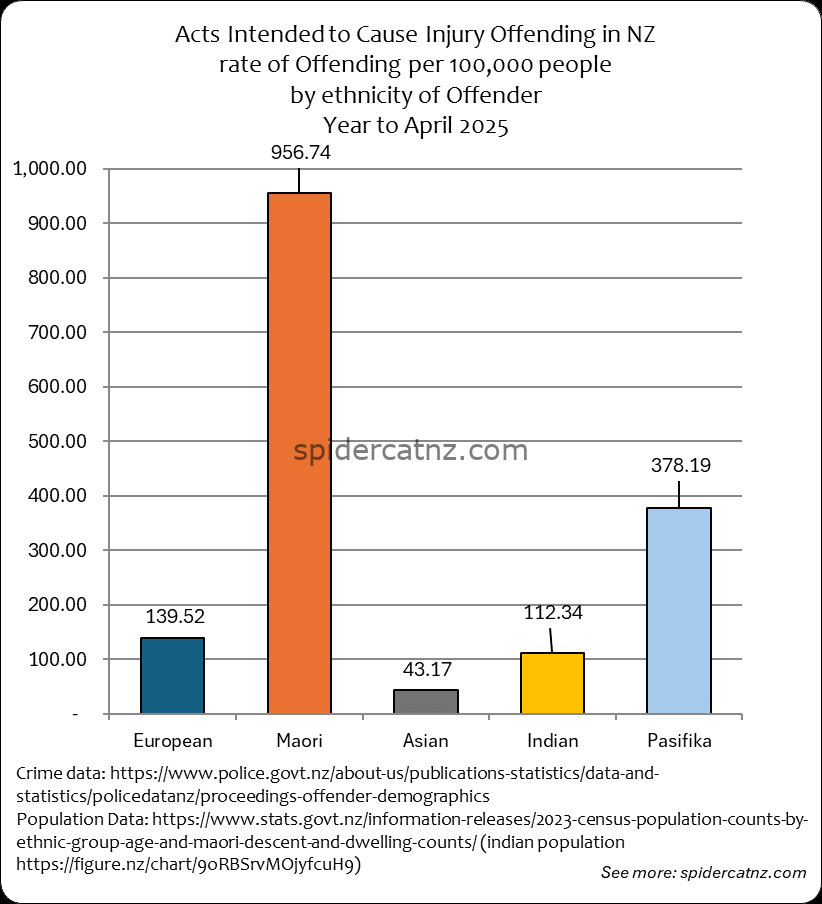
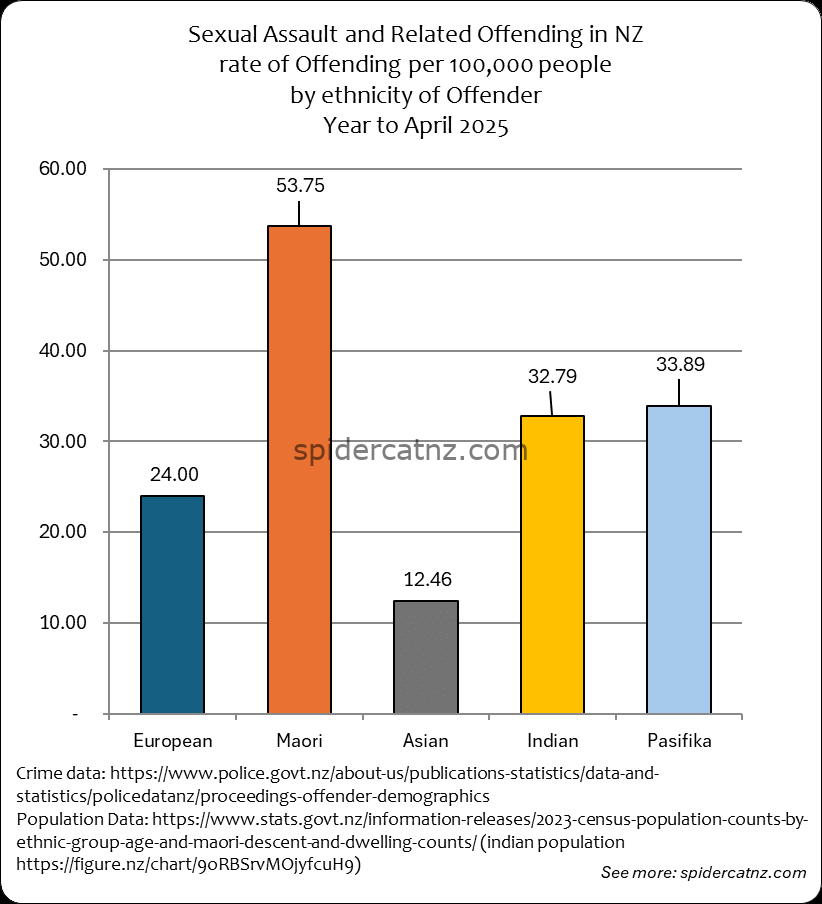
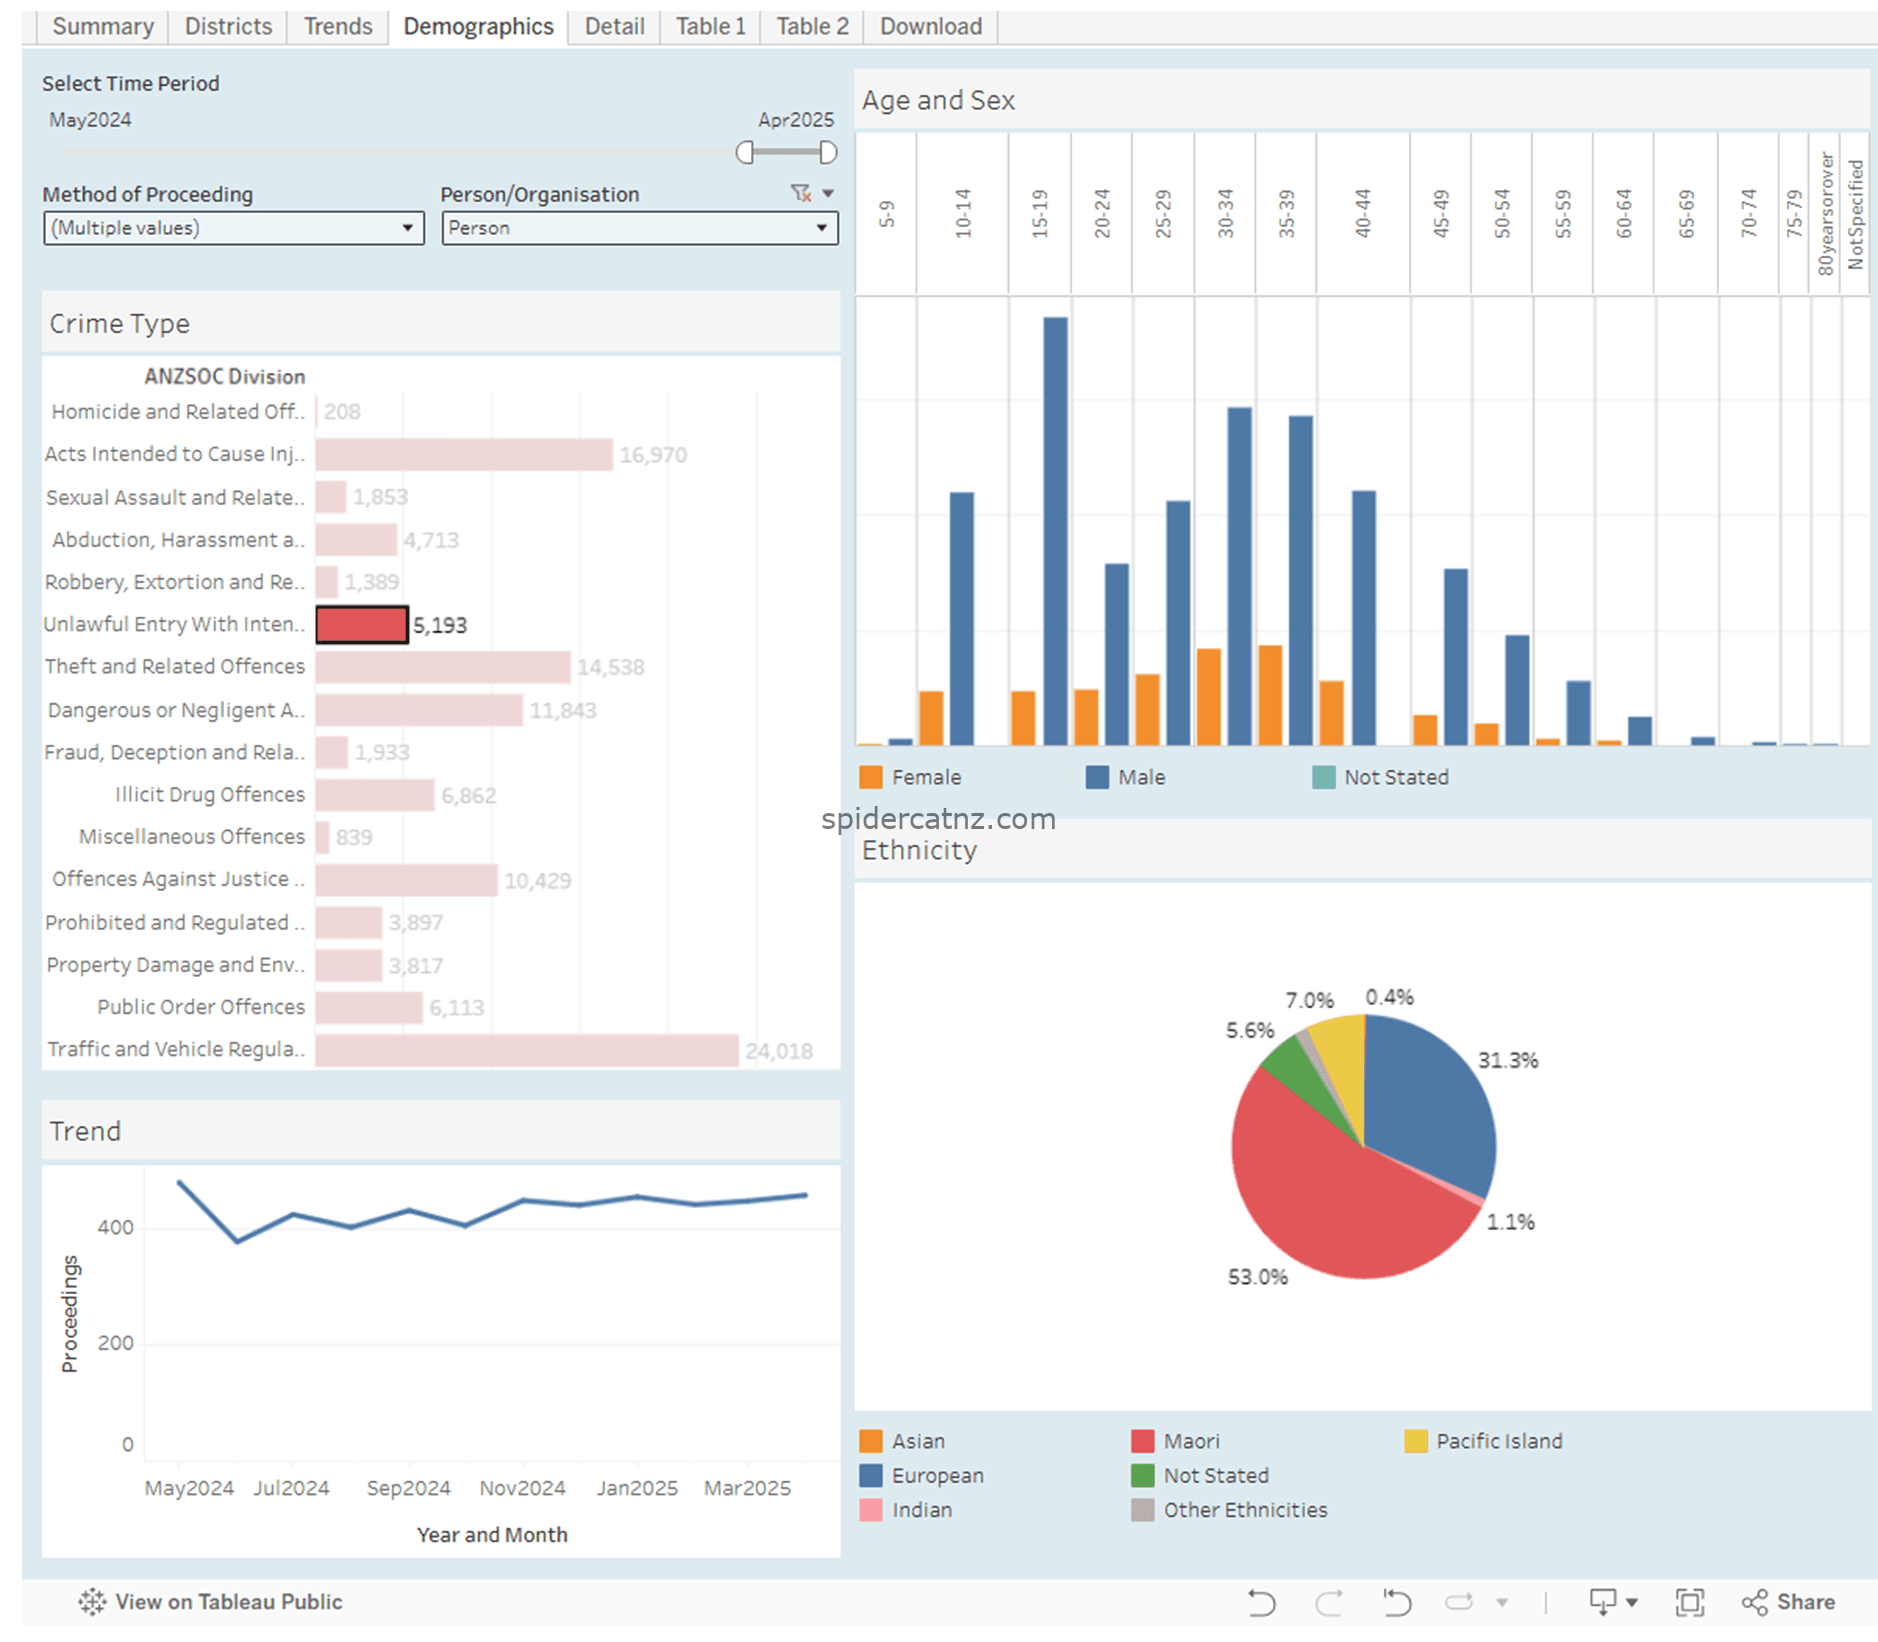
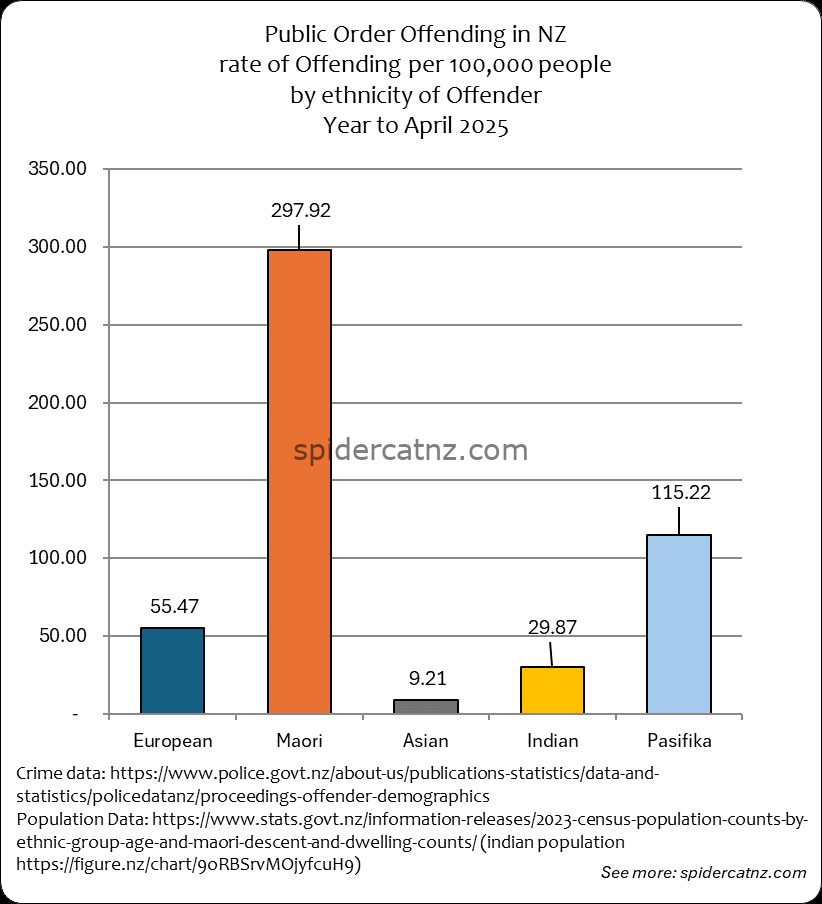
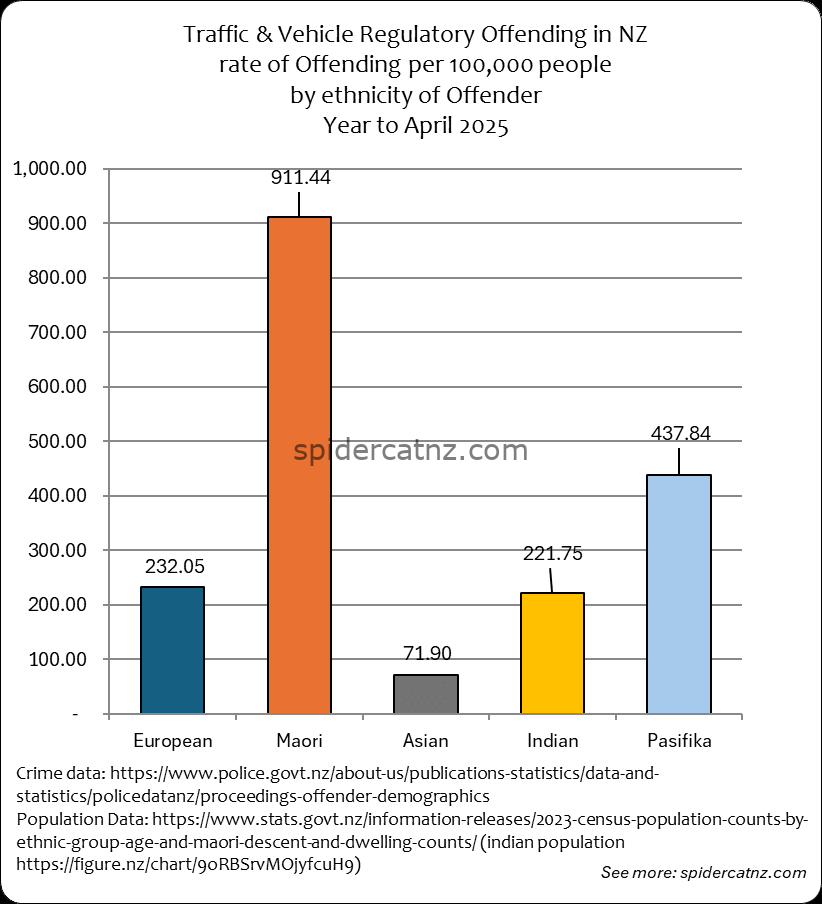
NZ Police Stats provide Demographic breakdown of offenders over time. Using the Census 2023 data, we can calculate the “per-capita” rate of Offending for each group, by dividing the total reported crimes by the number of people in each group. We then multiply that by 100,000 – showing the rate of offending per 100,000 people. This helps give a better picture than simple raw totals when group sizes differ.
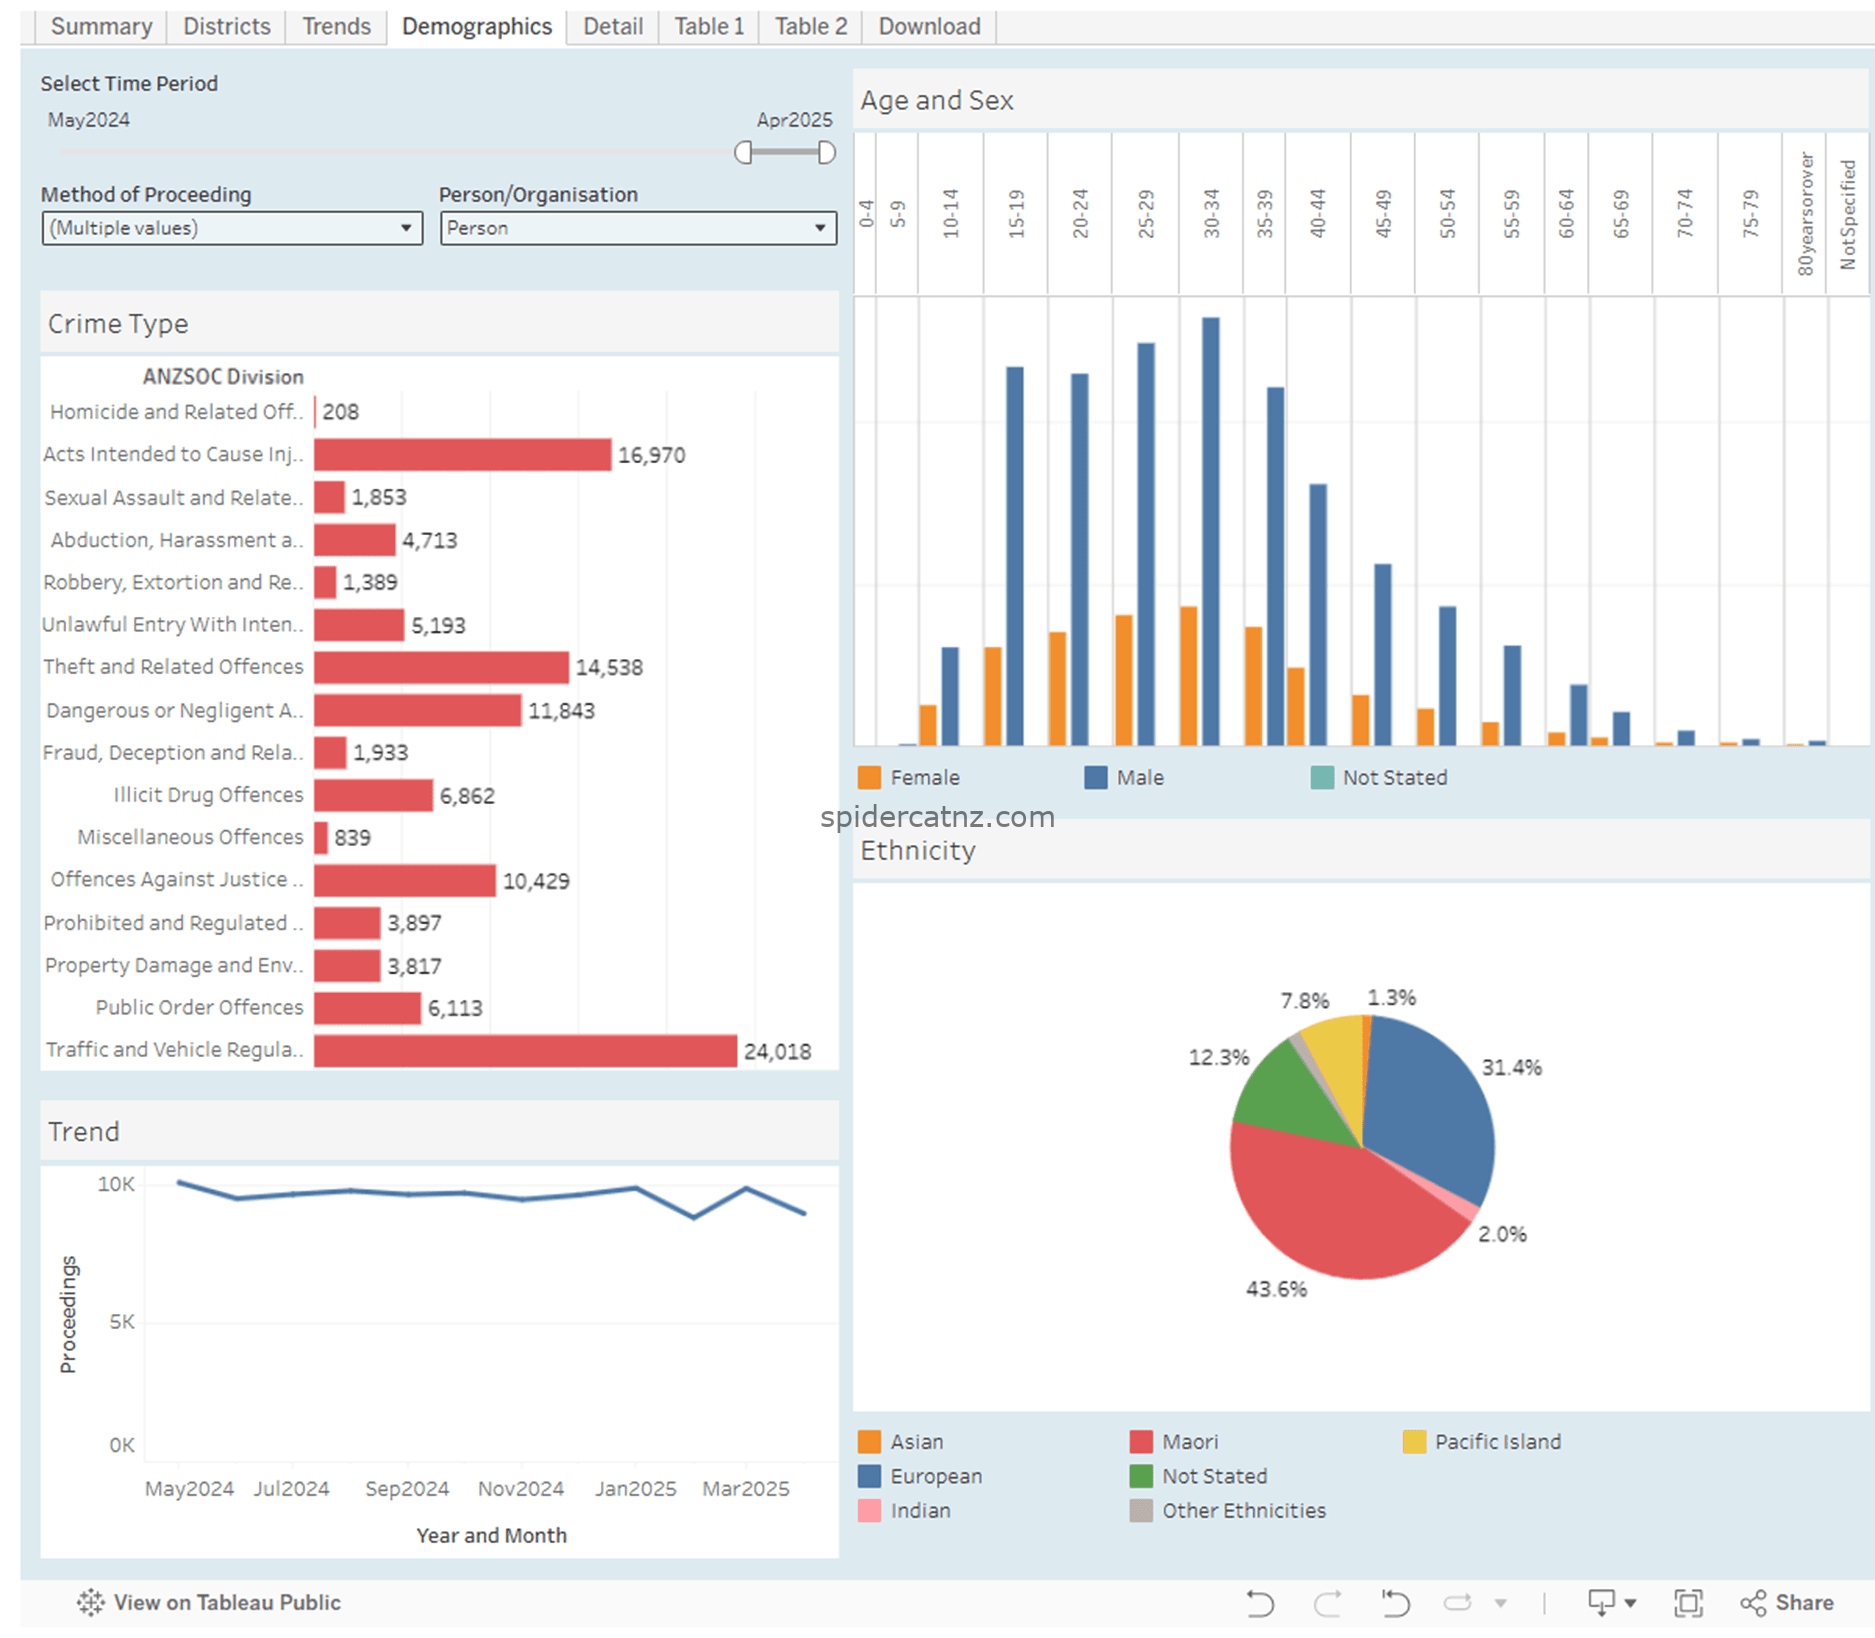
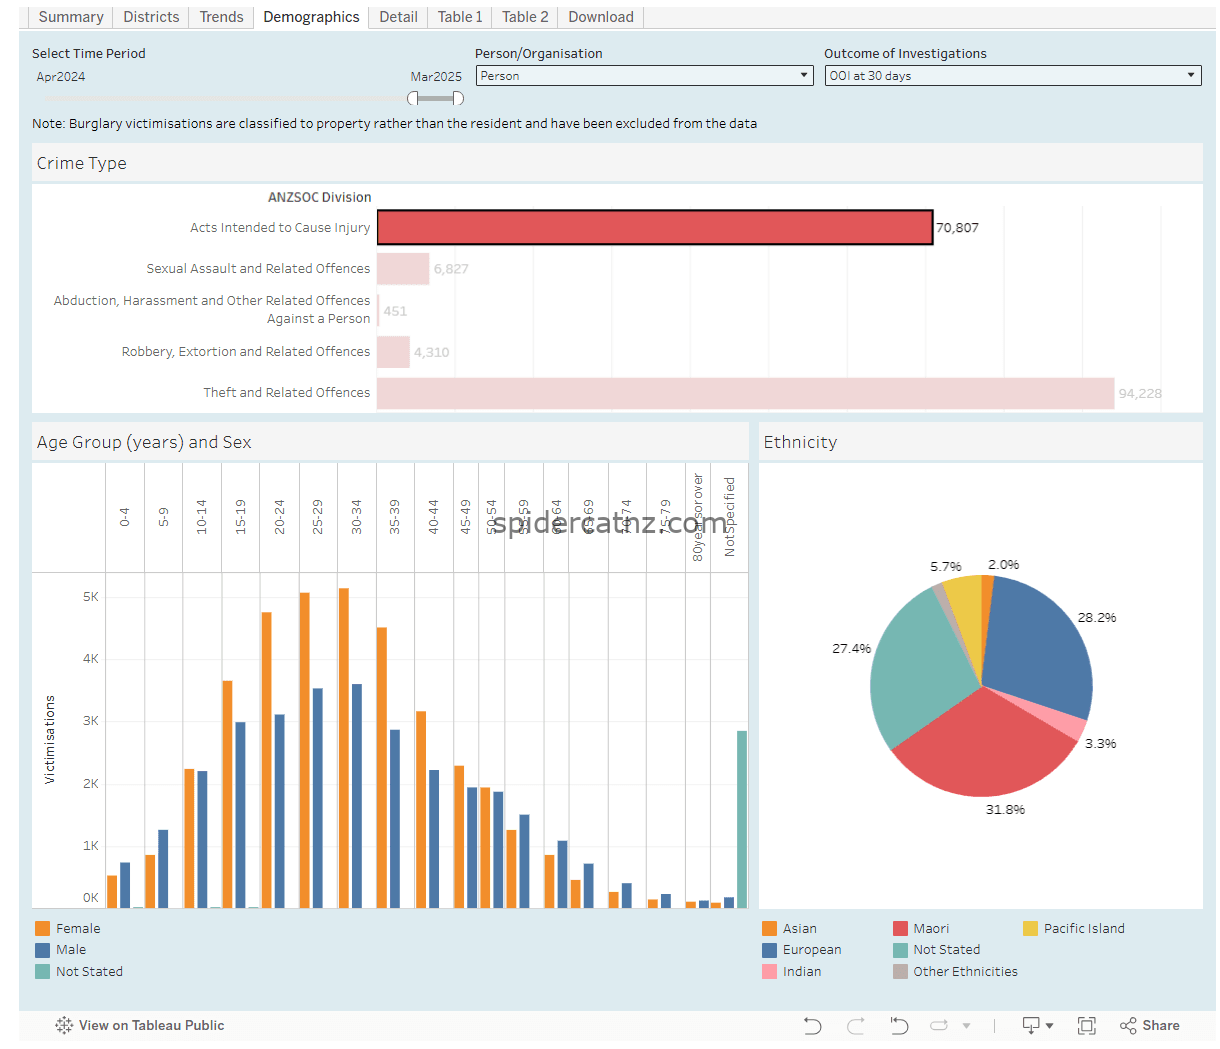
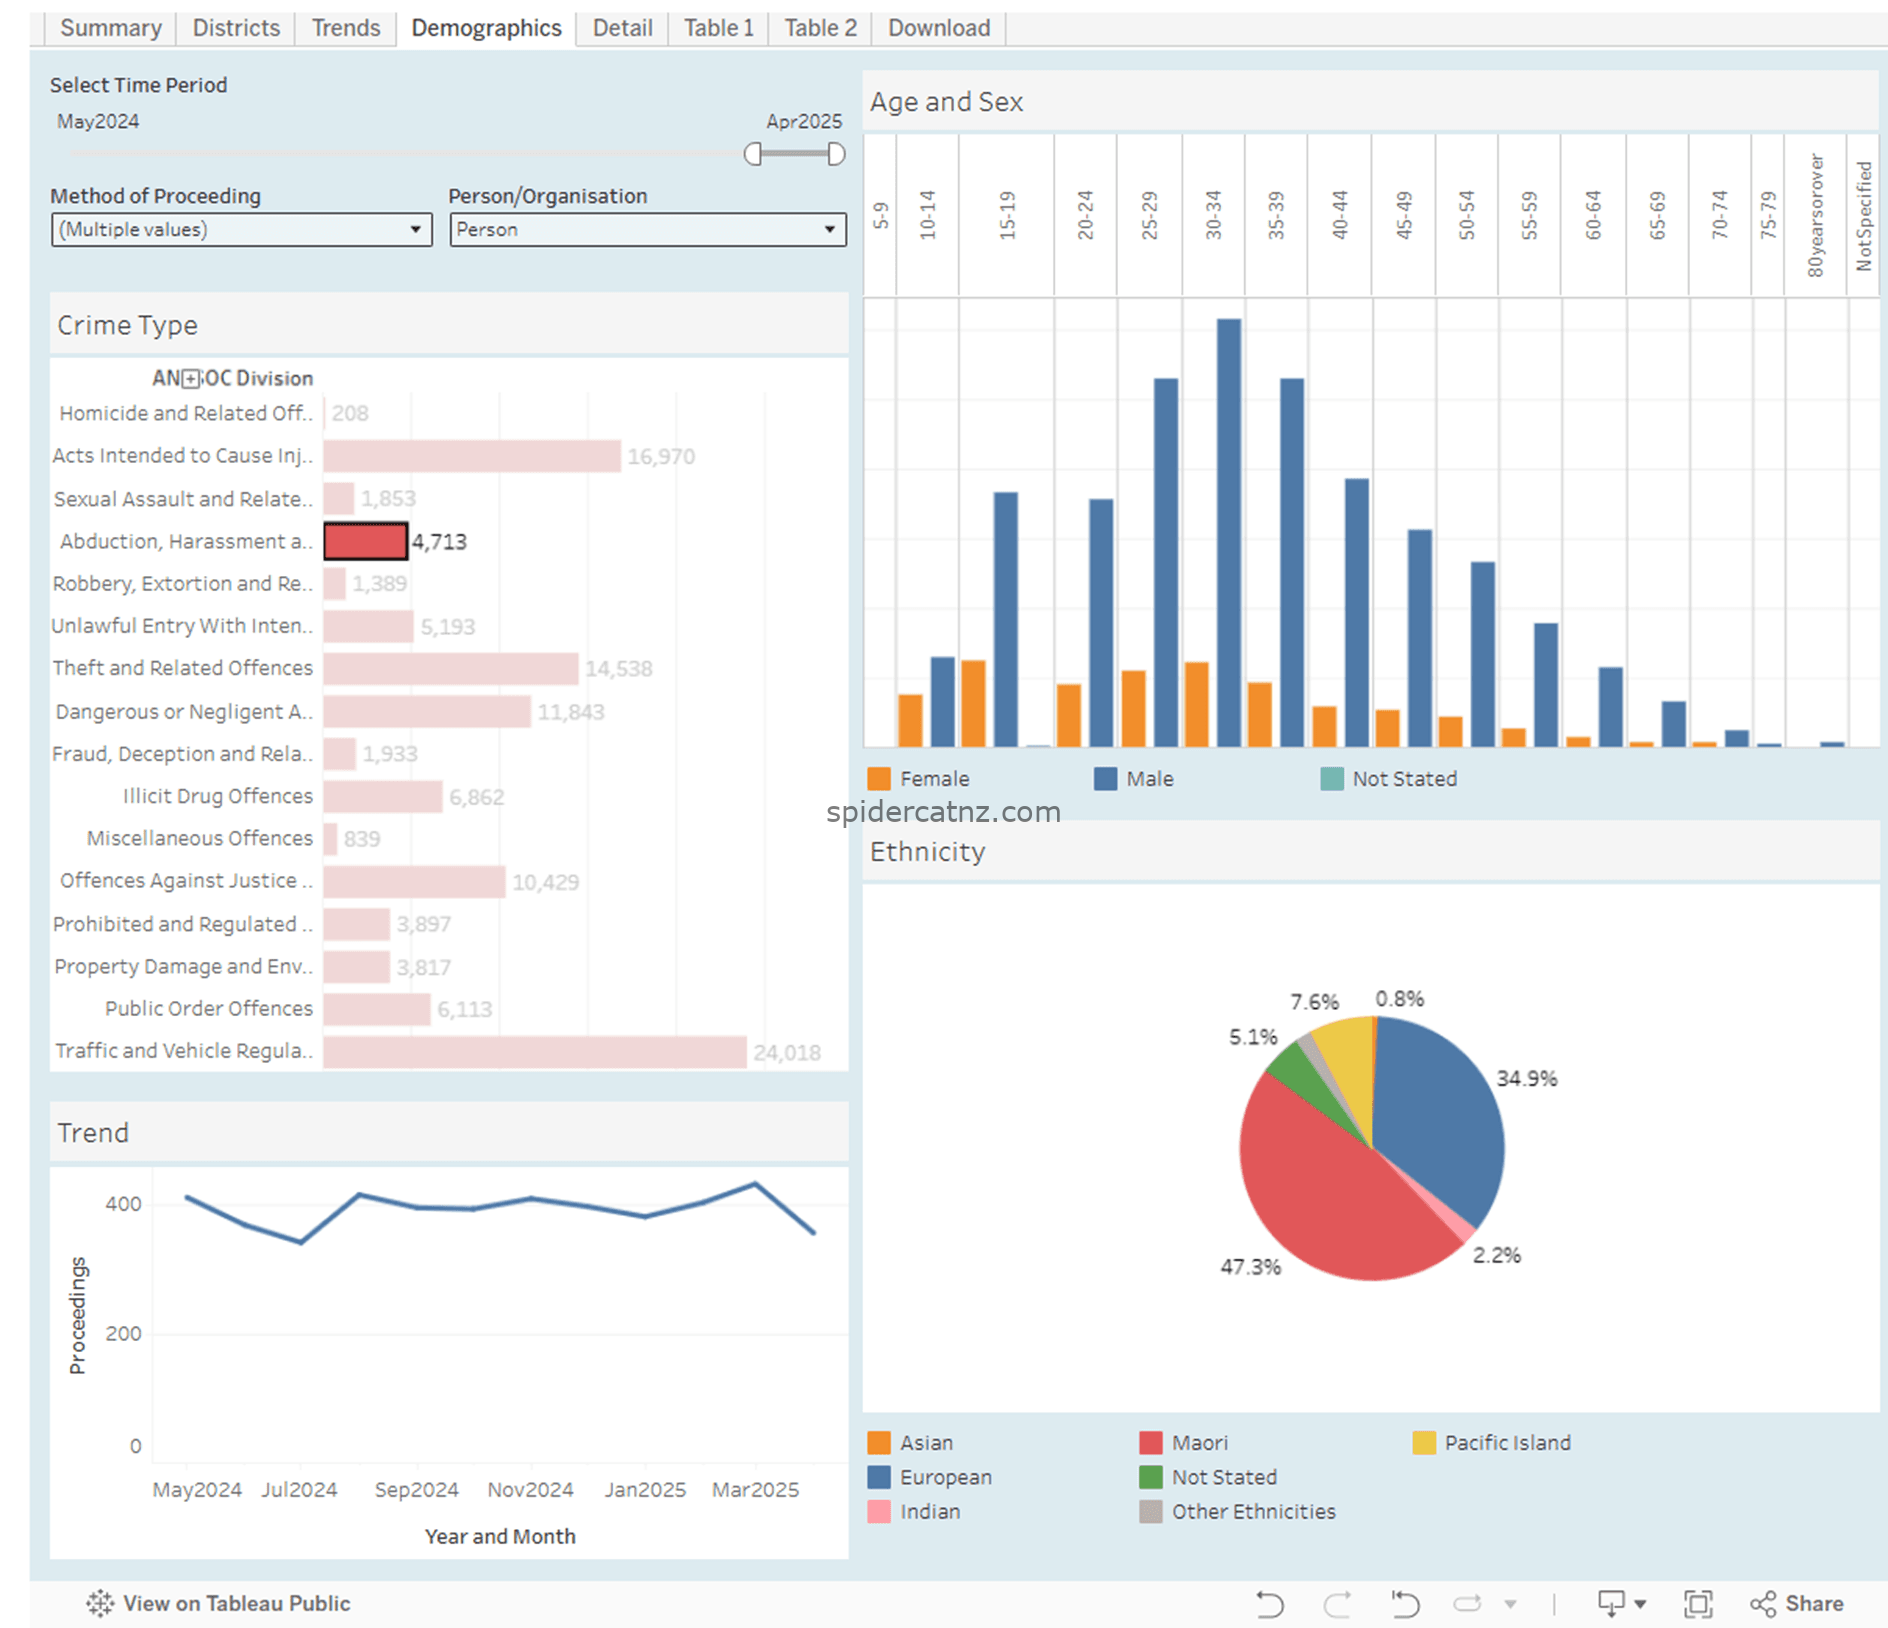
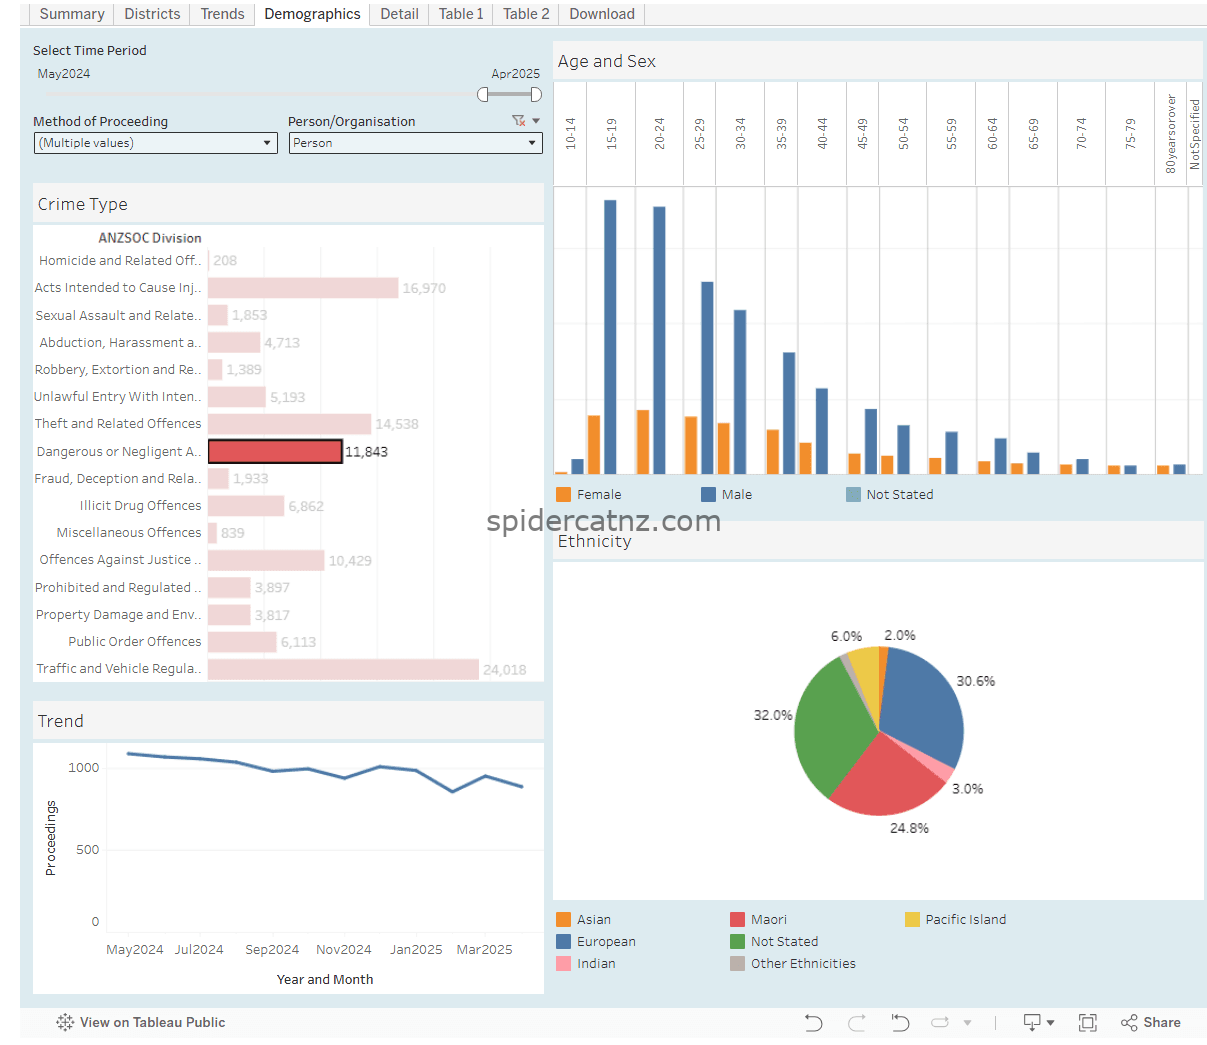
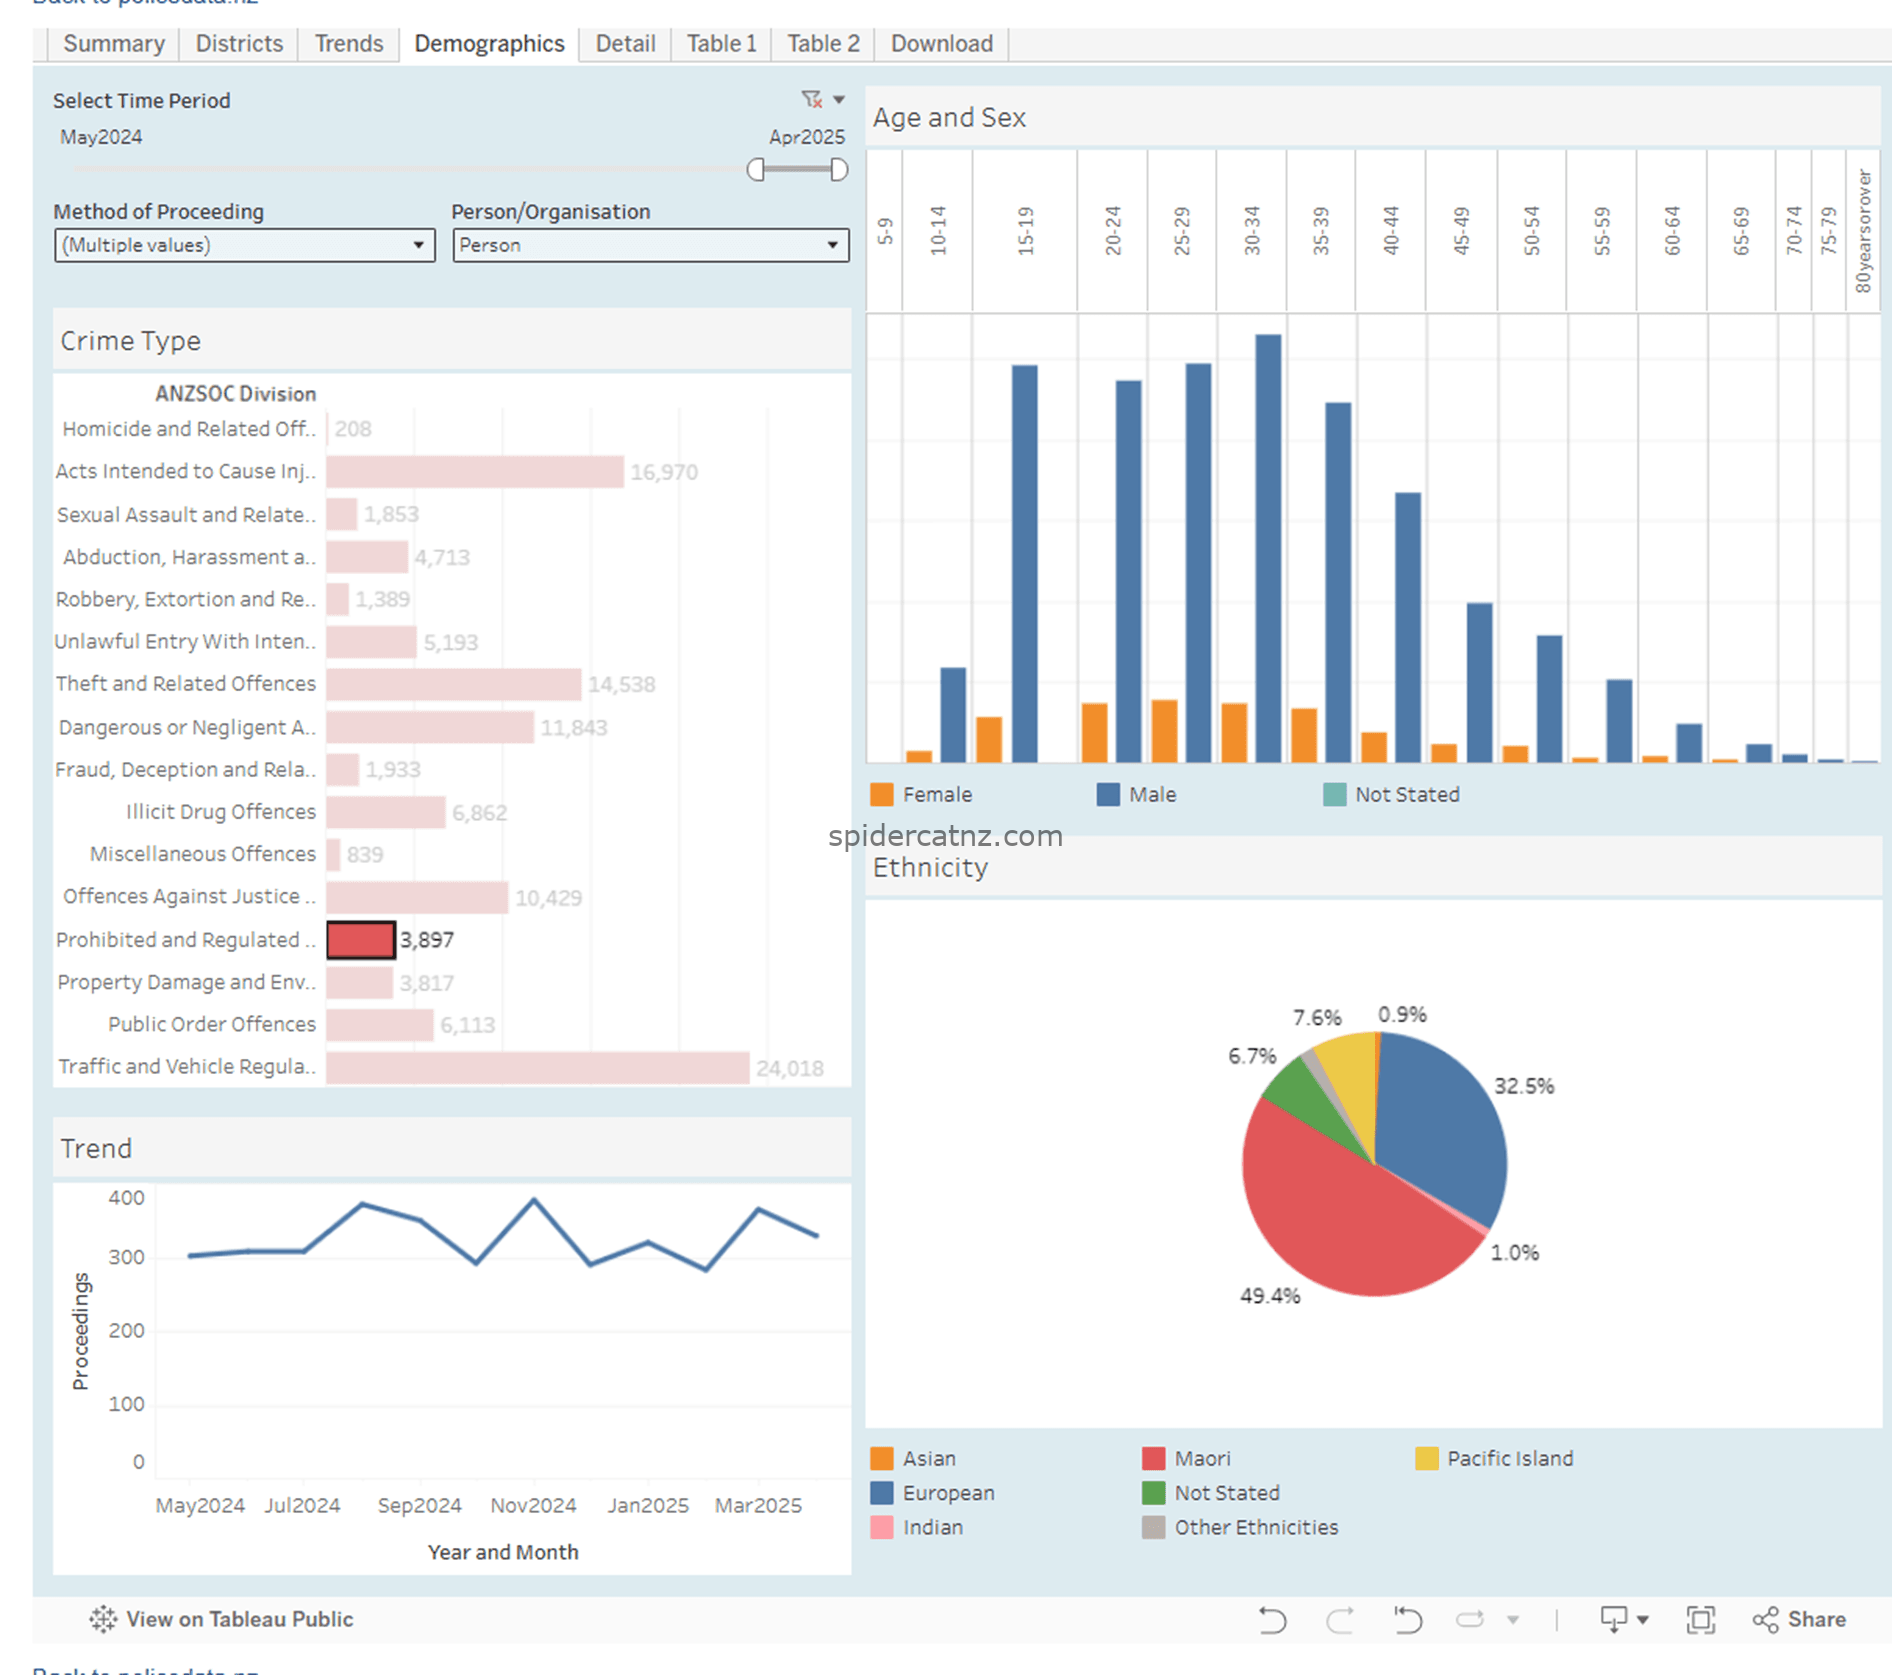
The crime information is sourced from the policedata section of the NZ Police site, it is a public Tableau database that is updated monthly.
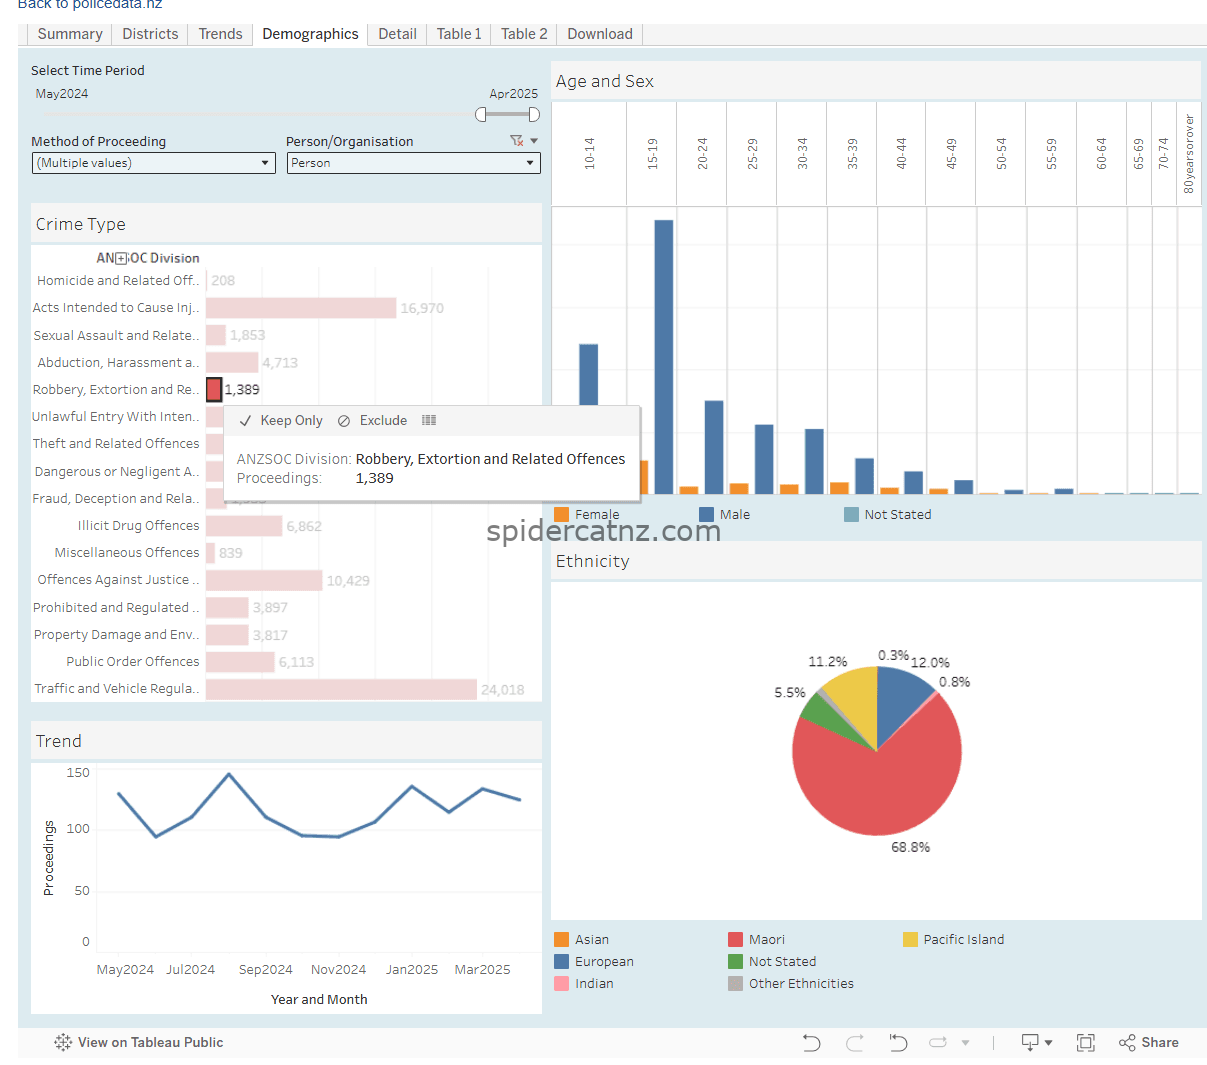
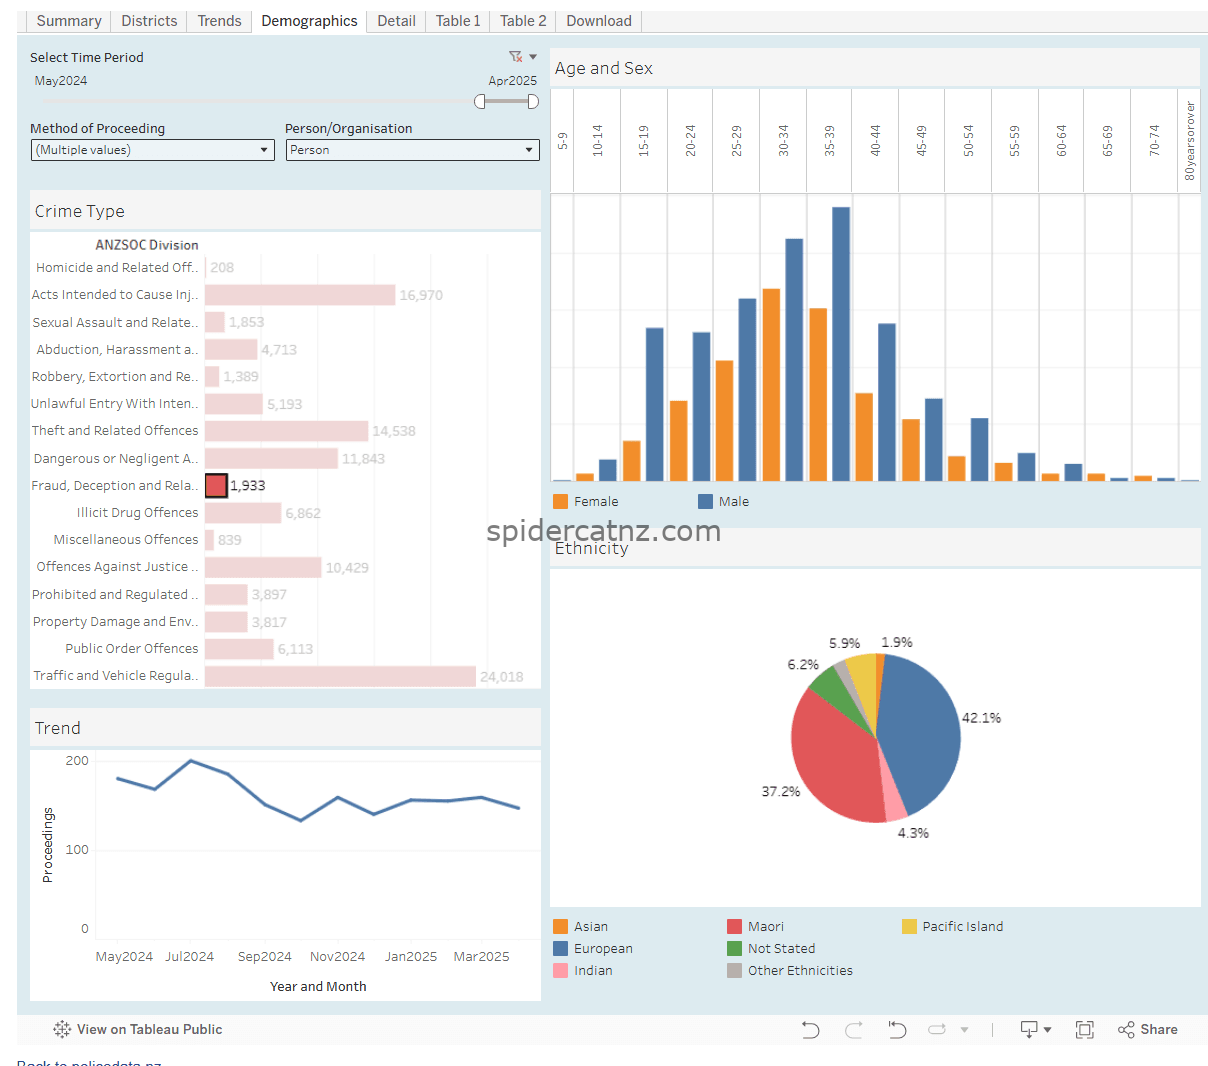
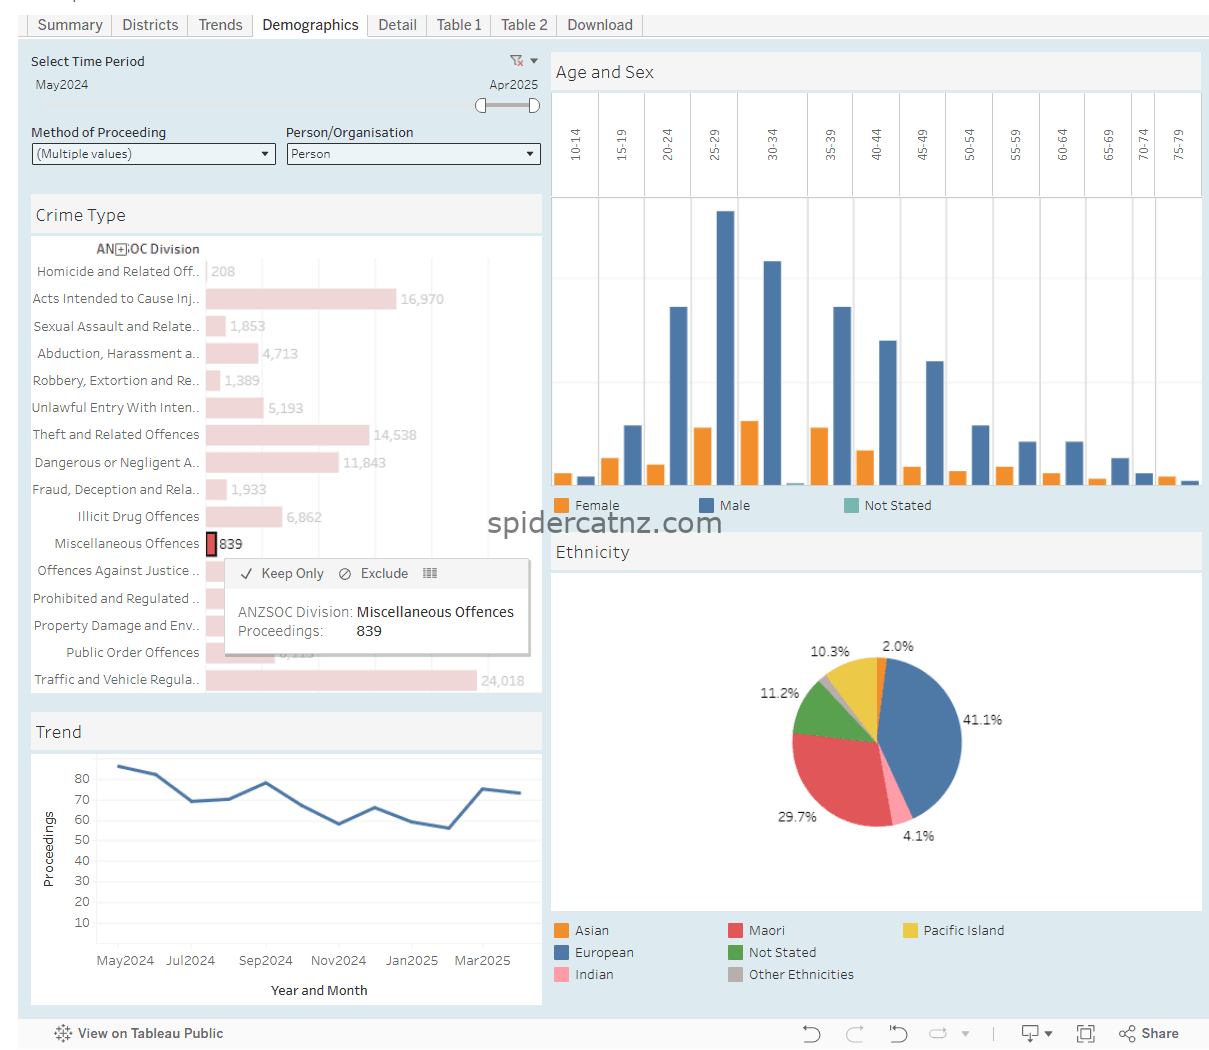
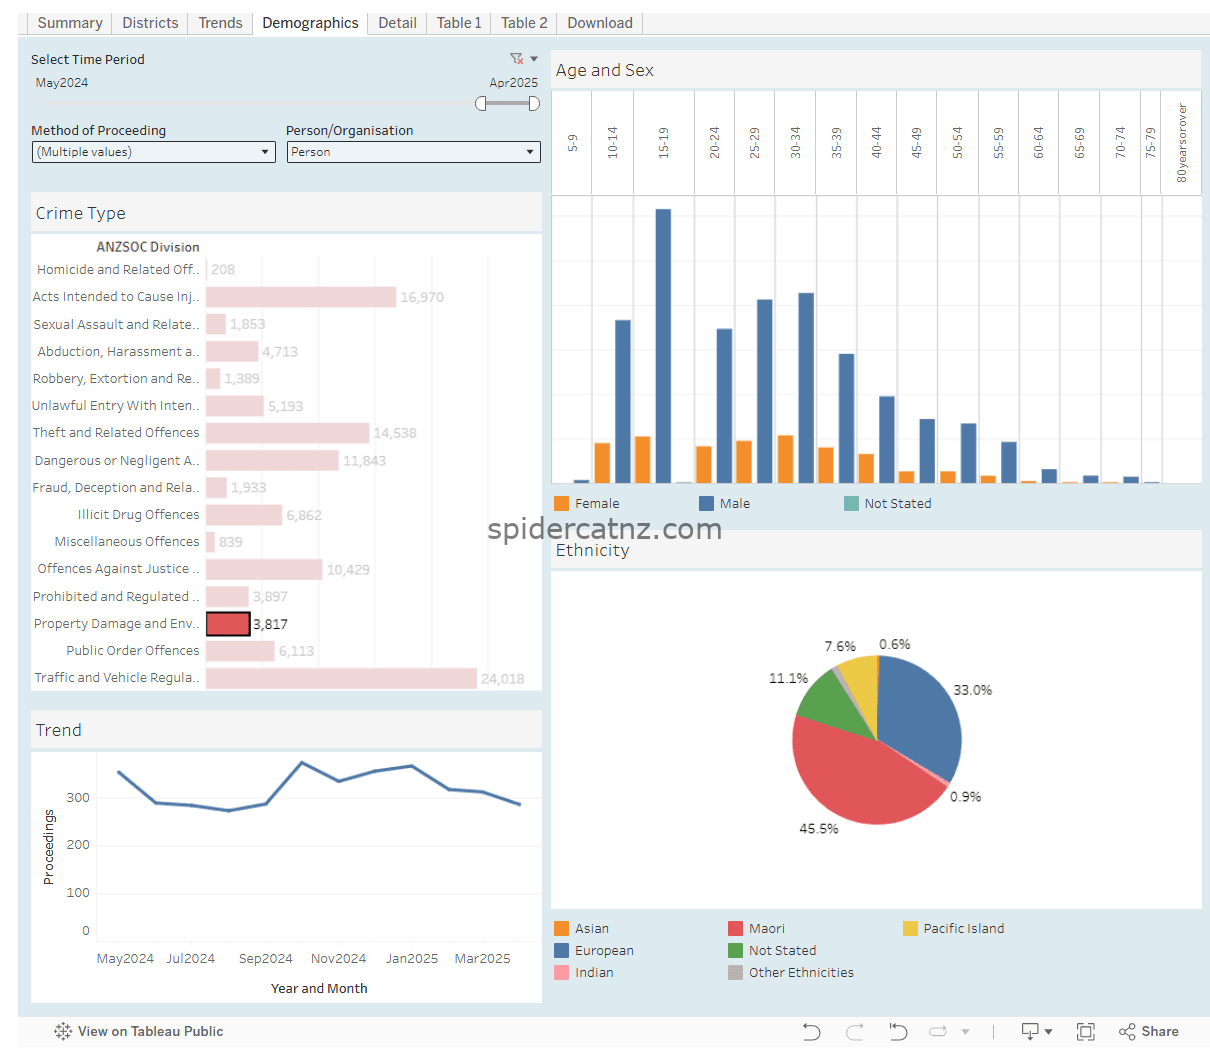
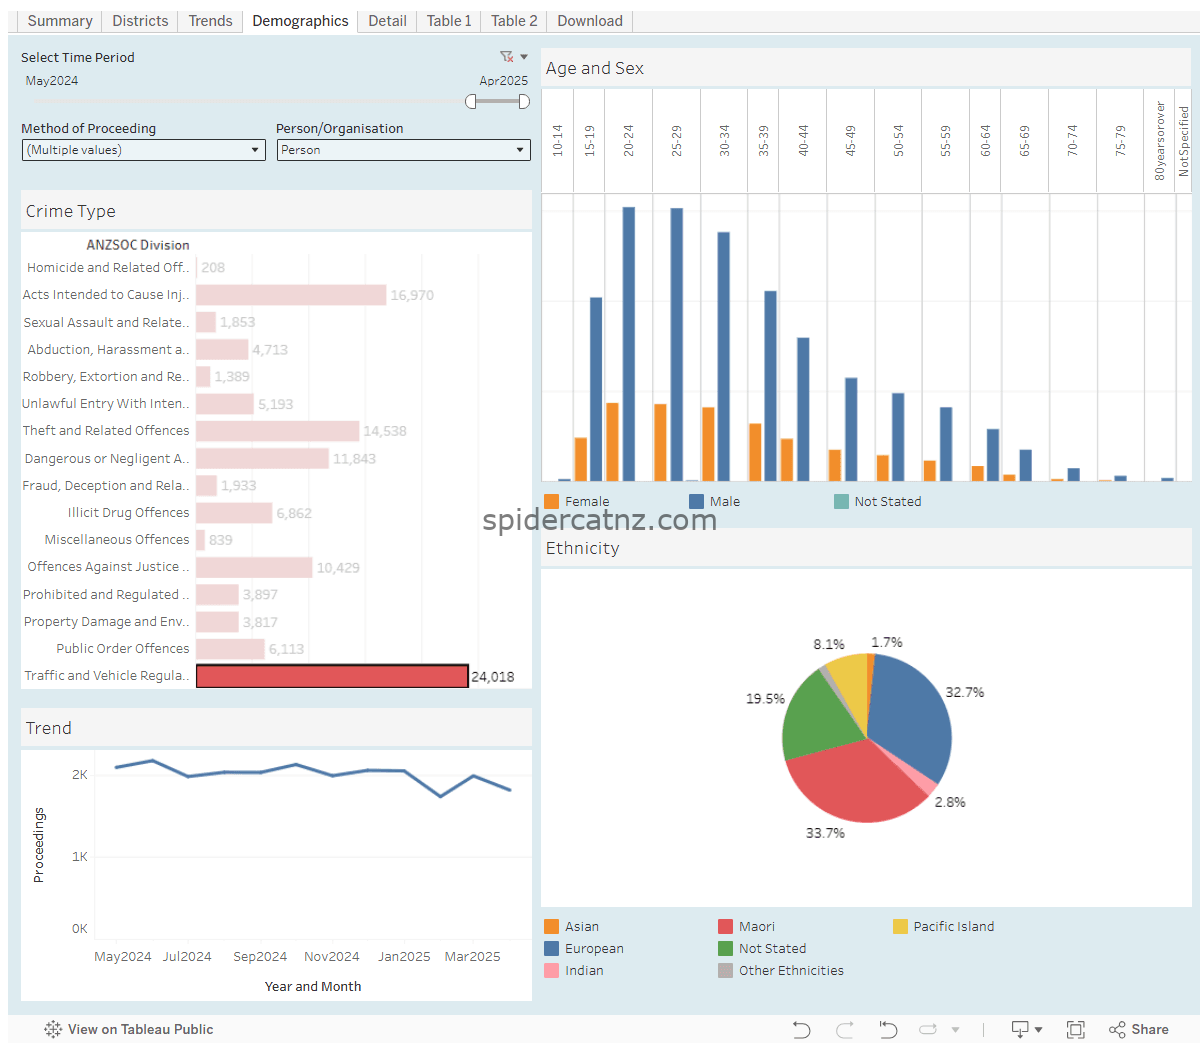
For this report I used the “Proceedings (offender demographics)” Tableau, using the Demographics tab, to describe the volumes and rates of crimes committed by people by demographic. These are all crimes where Proceedings were brought against an offender. If an offender had multiple Proceedings brought, they are all counted individually, not combined to one as in the “Unique Offenders” report.
For per-capita values, the “Undefined” and any unknown categories are Excluded from the total. This is any reported crime where the Ethnicity of the Offender is undetermined. Any entries with an Outcome of “Not Proceeded With” have been excluded.
** While it would be very interesting to be able to combine these reports to show which ethnic groups were victimising each ethnic groups, that is not possible with the Public Police Tableau data.
For more information on this report, please look at the source: https://www.police.govt.nz/about-us/publications-statistics/data-and-statistics/policedatanz/proceedings-offender-demographics
For more information on what each of the “divisions” below mean, see the ANZSOC: https://www.abs.gov.au/statistics/classifications/australian-and-new-zealand-standard-offence-classification-anzsoc/latest-release


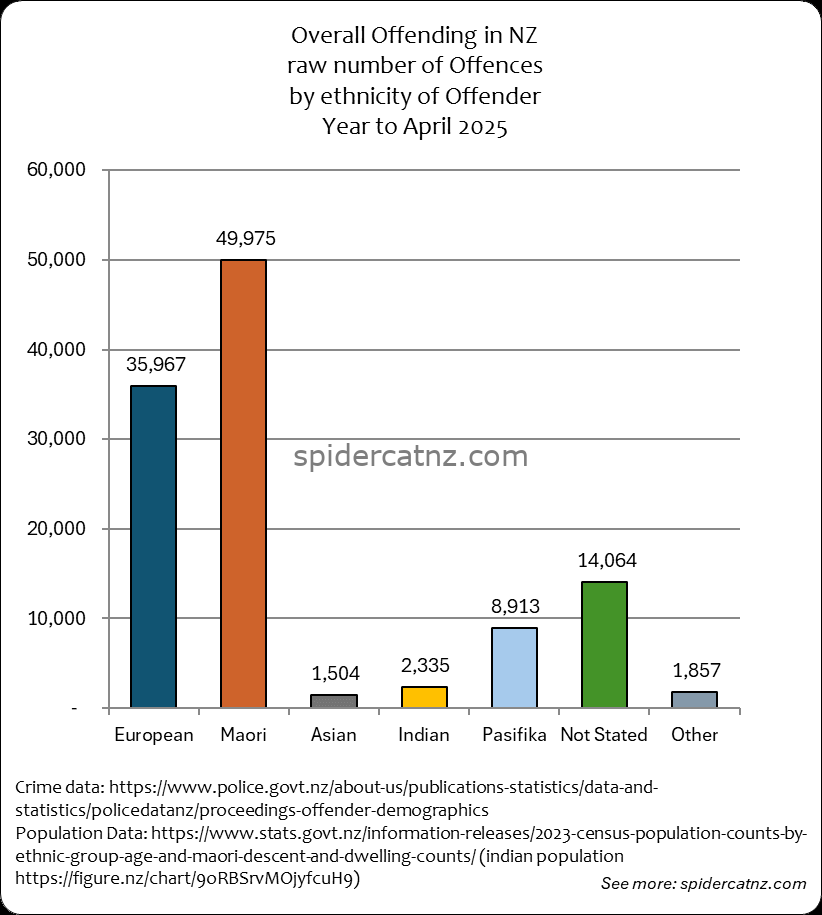
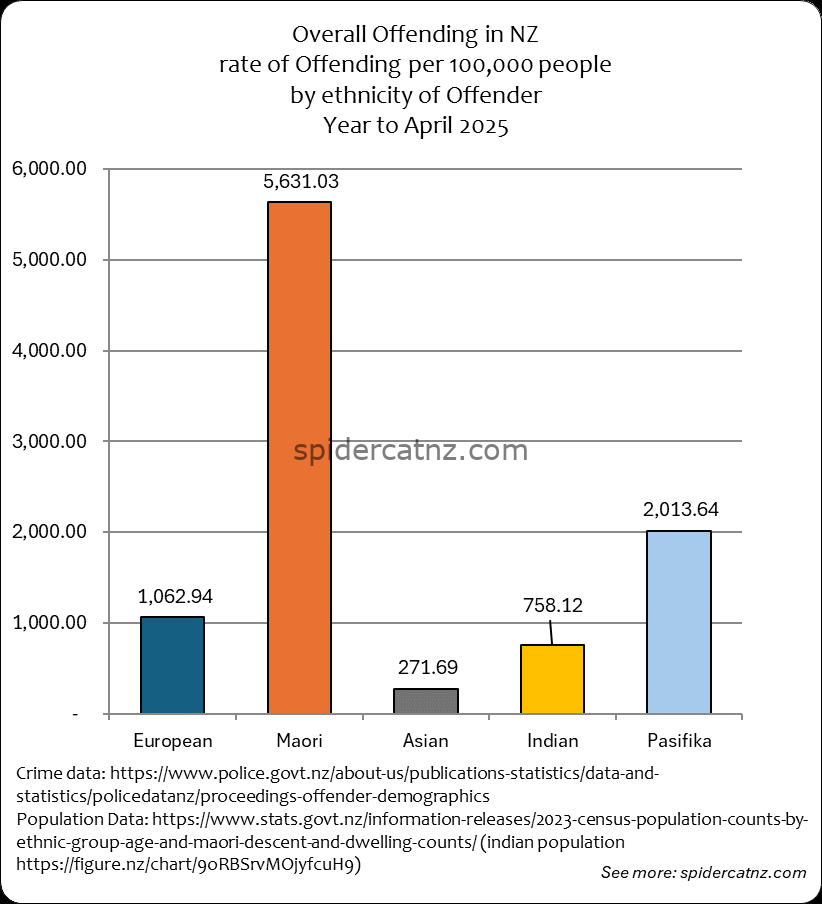
Overall Offending by Ethnicity
This graph shows all Crimes where an offender was identified and proceedings were brought from May 2024 to April 2025, by ethnic group of the Offender:
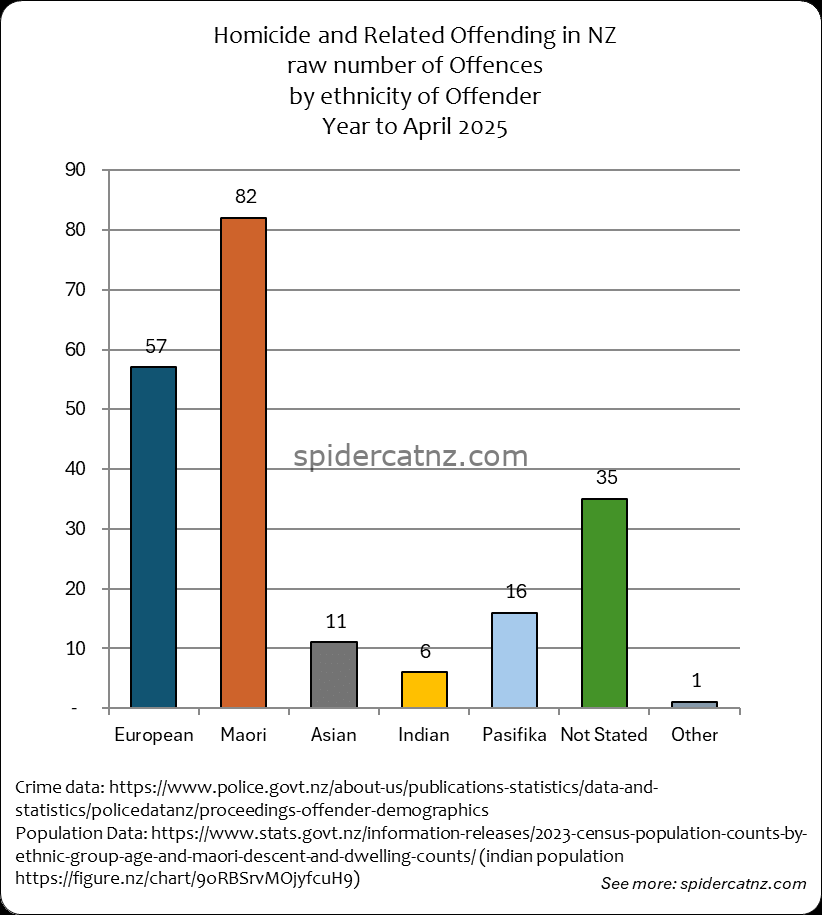
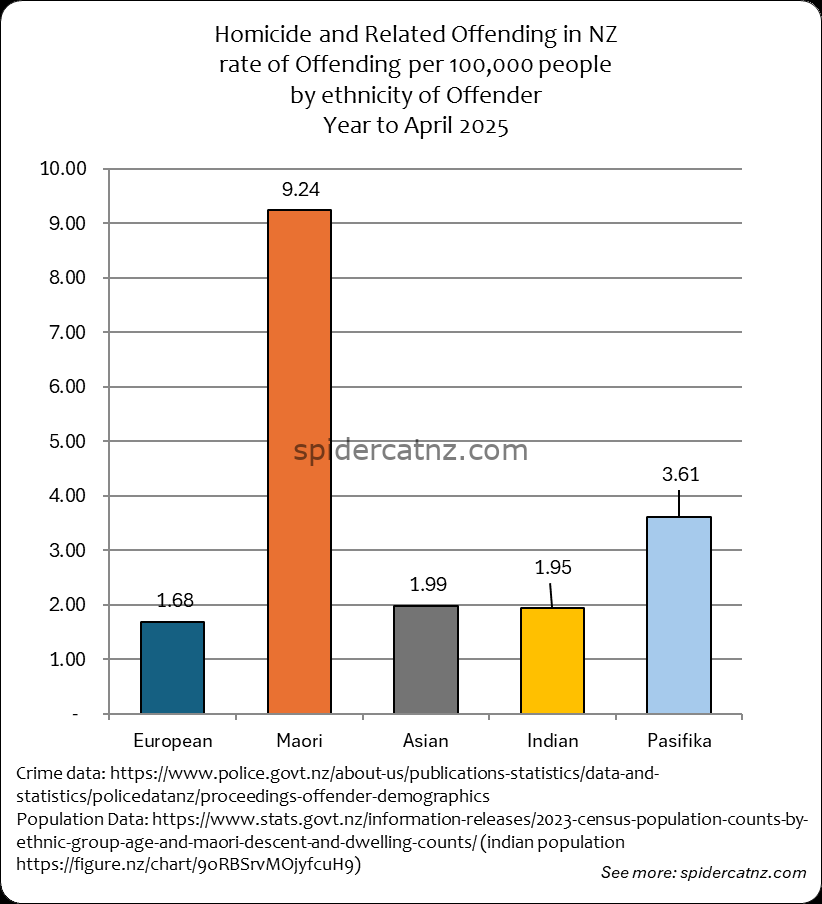
Homicide and Related Offending by Ethnicity
This graph shows all Homicide and Related Crimes where an offender was identified and proceedings were brought from May 2024 to April 2025, by ethnic group of the Offender
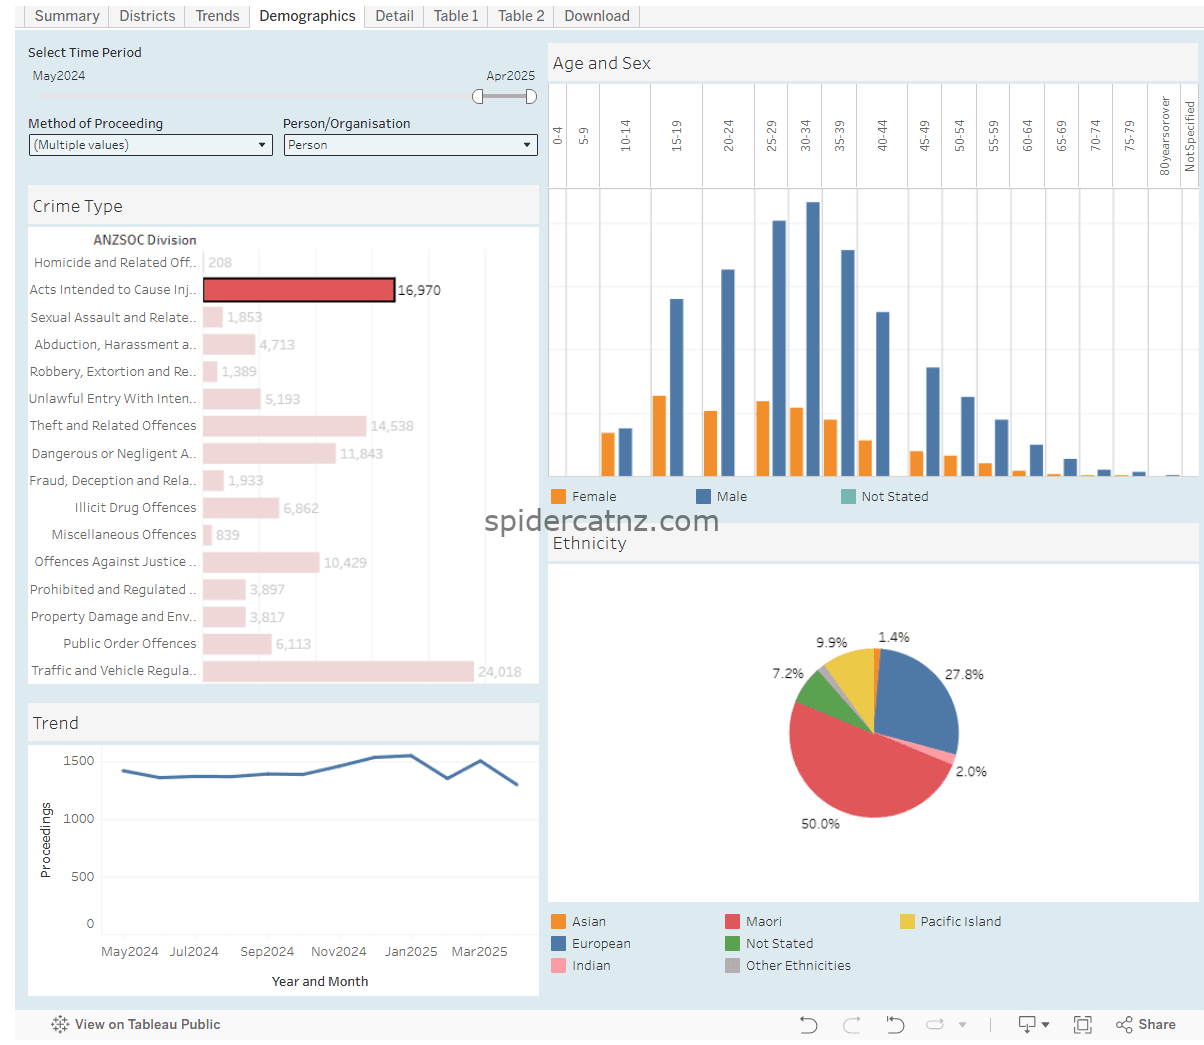
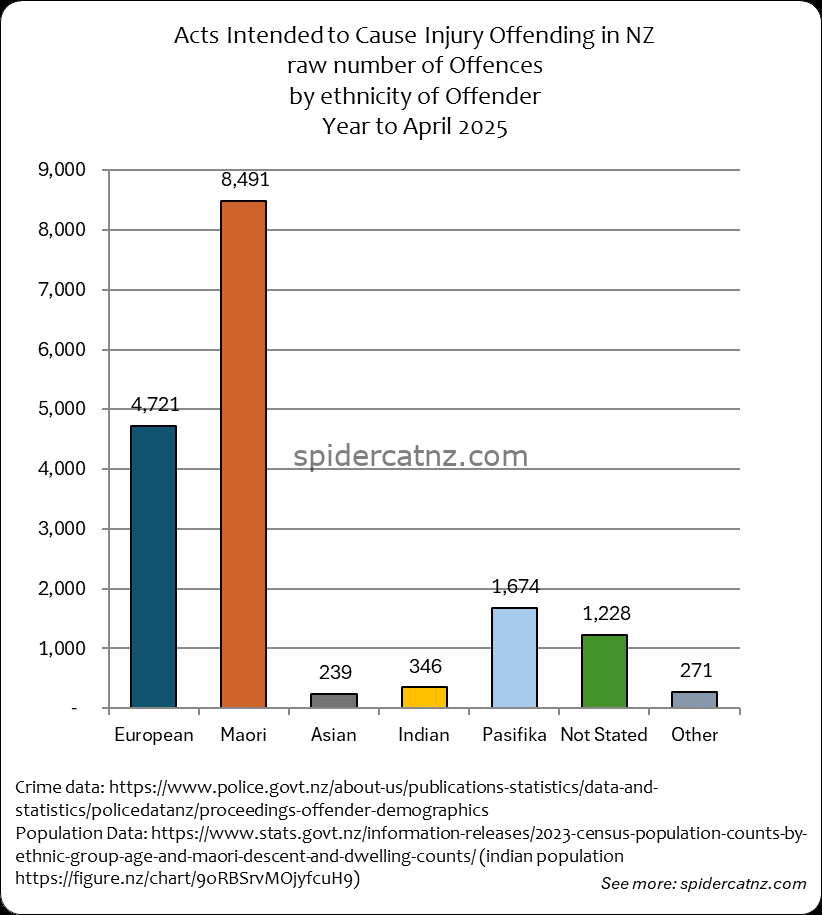
Acts Intended to Cause Injury Offending by Ethnicity
This graph shows all Acts Intended to Cause Injury Crimes where an offender was identified and proceedings were brought from May 2024 to April 2025, by ethnic group of the Offender.
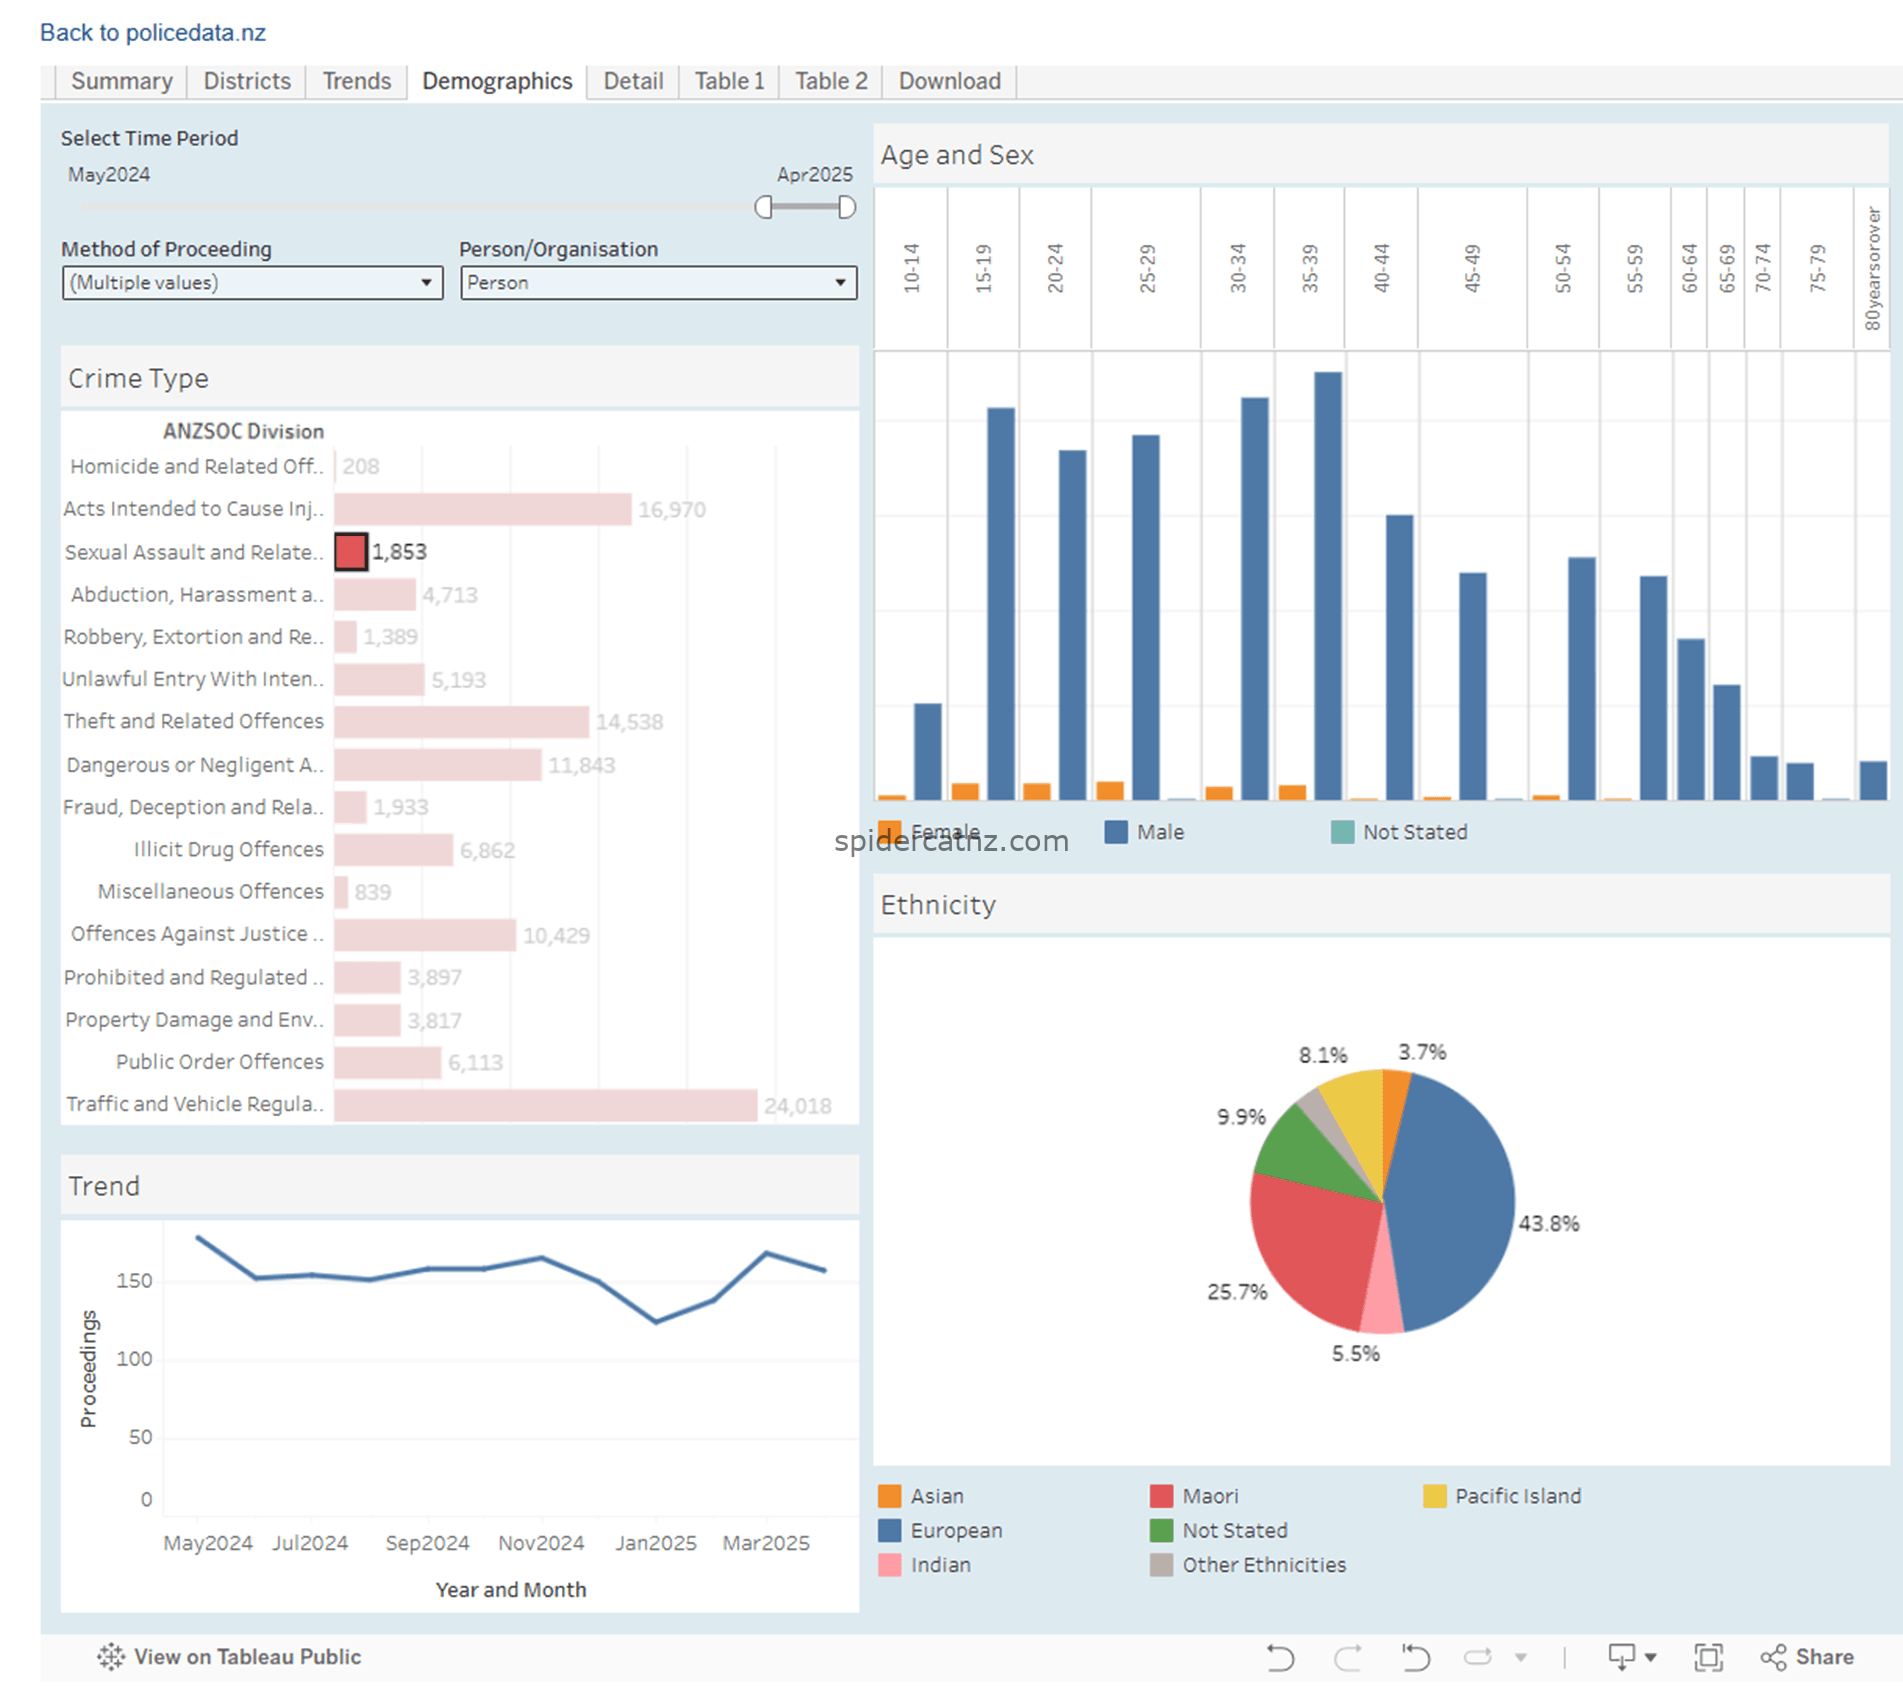
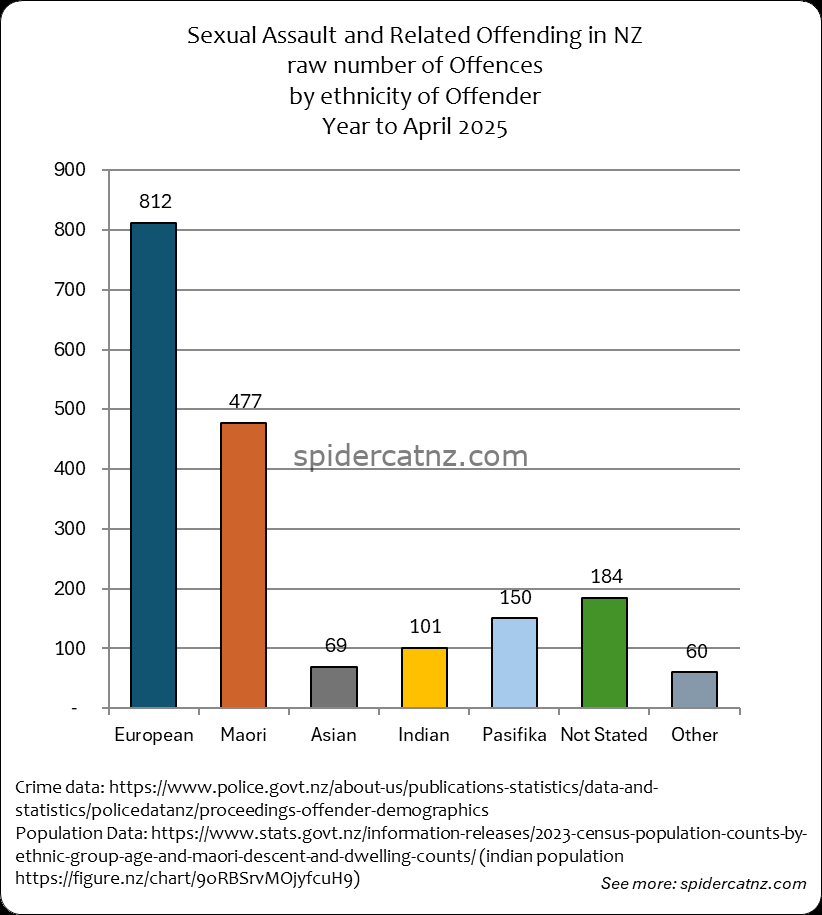
Sexual Assault Offending by Ethnicity
This graph shows all reported Sexual Assault crimes where an offender was identified and proceedings were brought from May 2024 to April 2025, by ethnic group of the Offender.
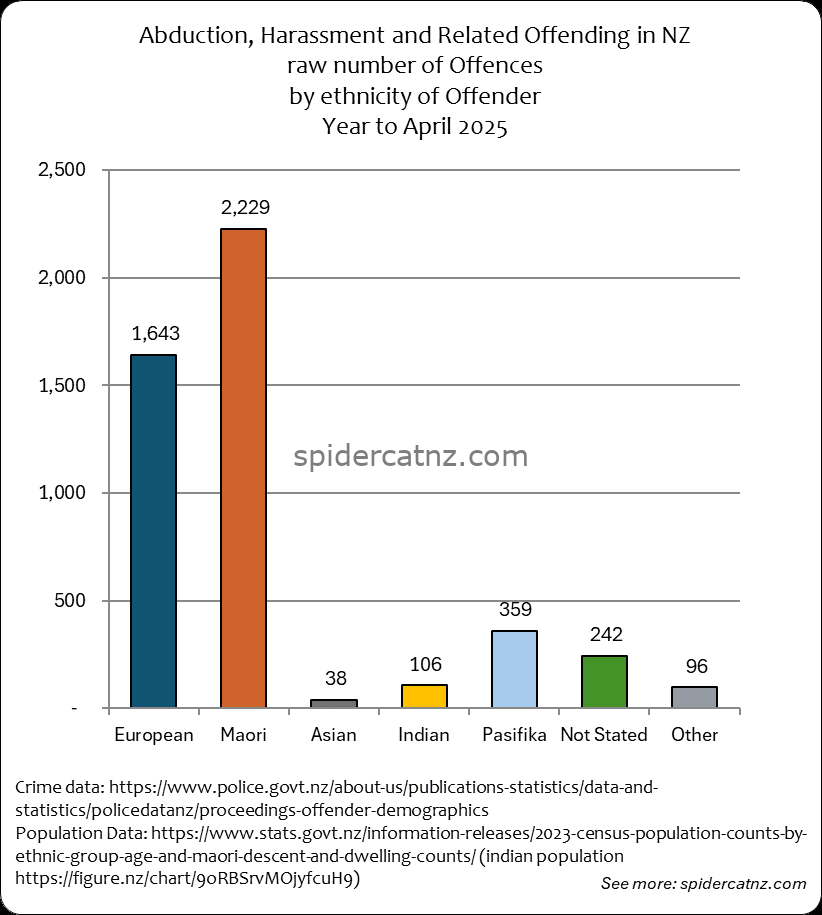
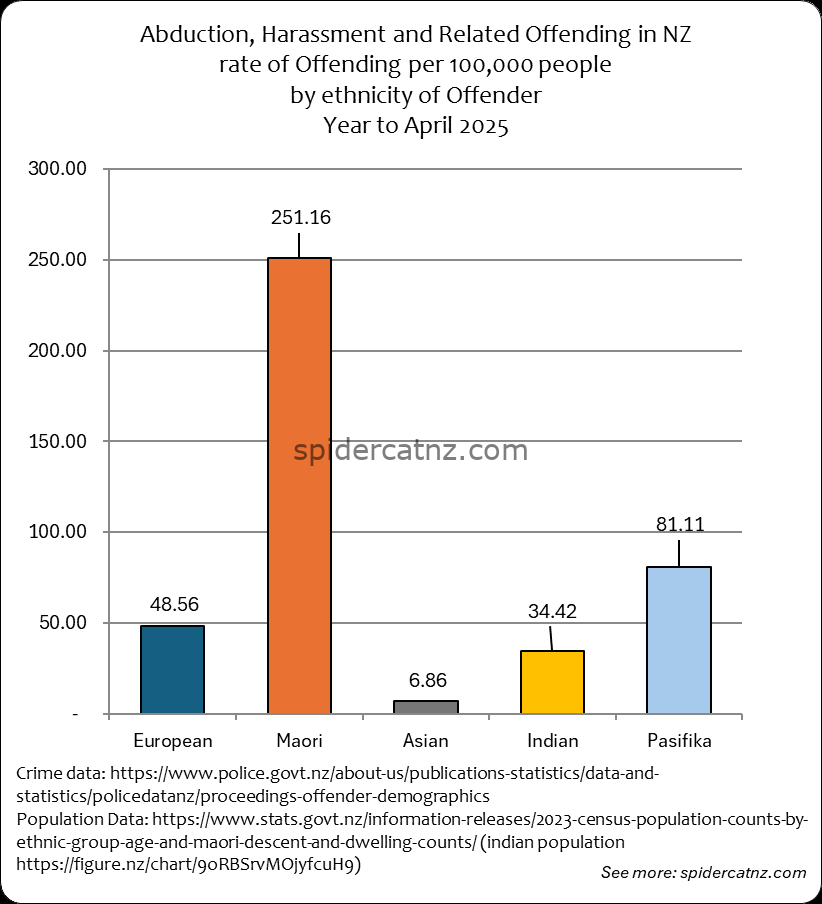
Abduction/Harassment Offending by Ethnicity
This graph shows all reported Abduction & Harassment crime where an offender was identified and proceedings were brought from May 2024 to April 2025, by ethnic group of the Offender:
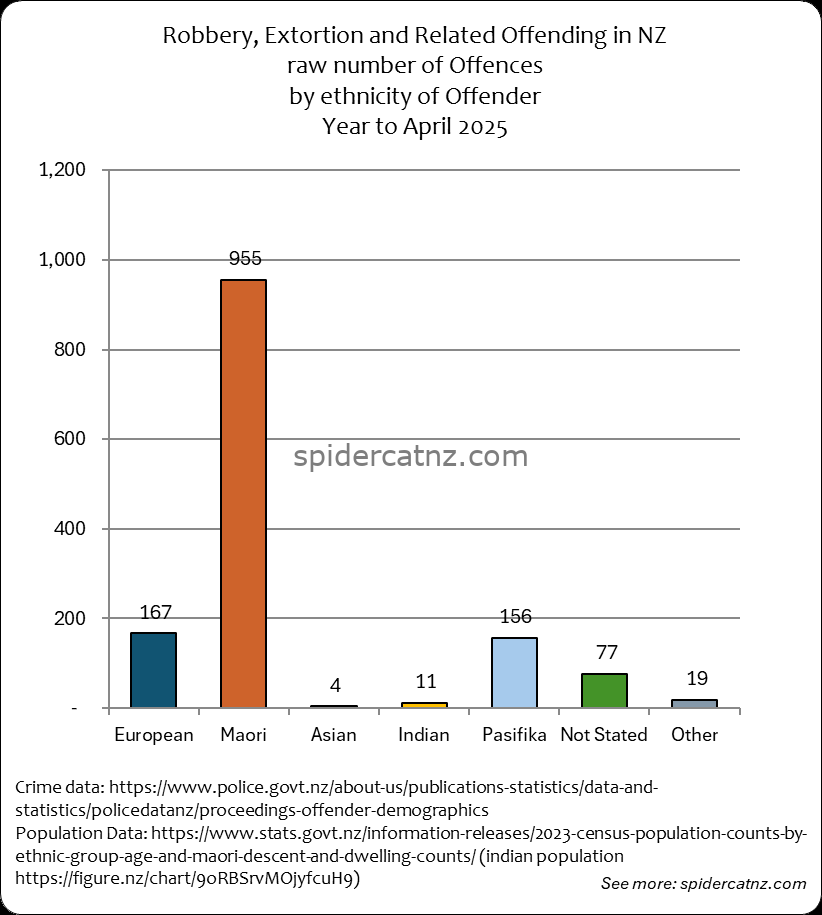
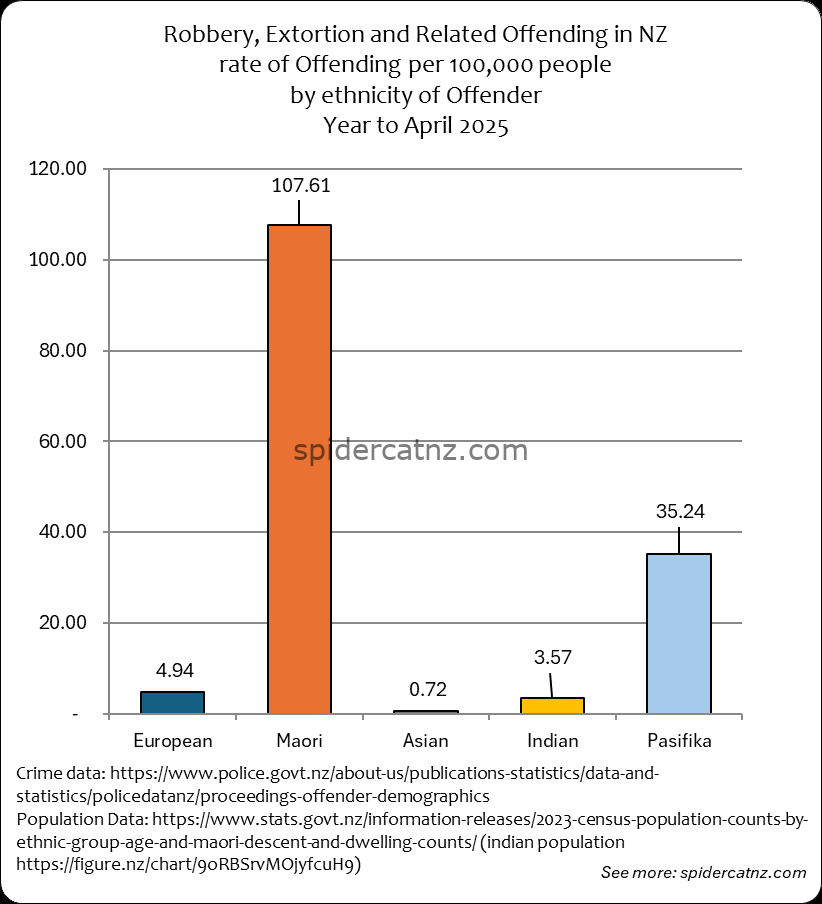
Robbery/Extortion Offending by Ethnicity
This graph shows all reported Robbery and Extortion related crime where an offender was identified and proceedings were brought from May 2024 to April 2025, by ethnic group of the Offender:
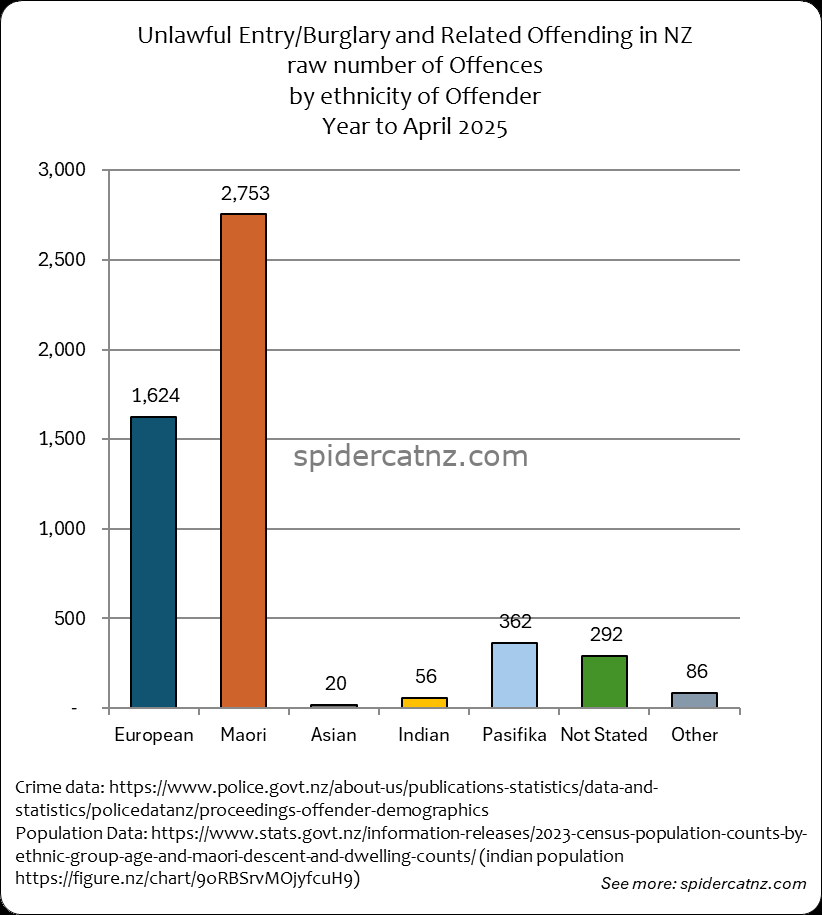
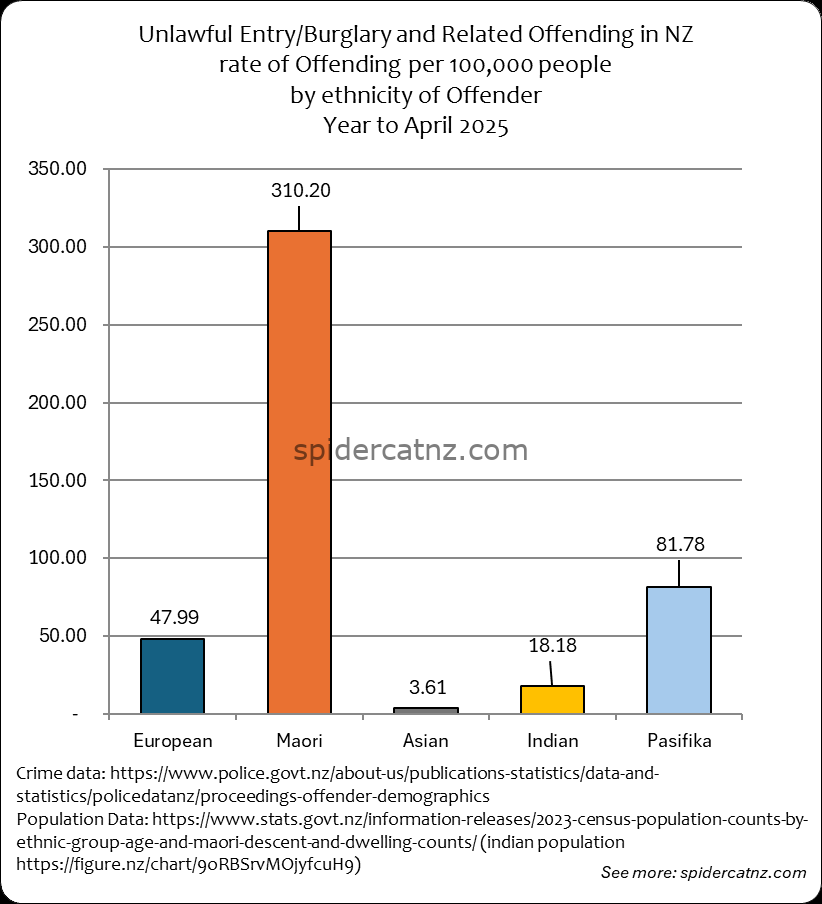
Unlawful Entry/Burglary and Related Offending by Ethnicity
This graph shows all reported Unlawful Entry/Burglary and related crime where an offender was identified and proceedings were brought from May 2024 to April 2025, by ethnic group of the Offender:
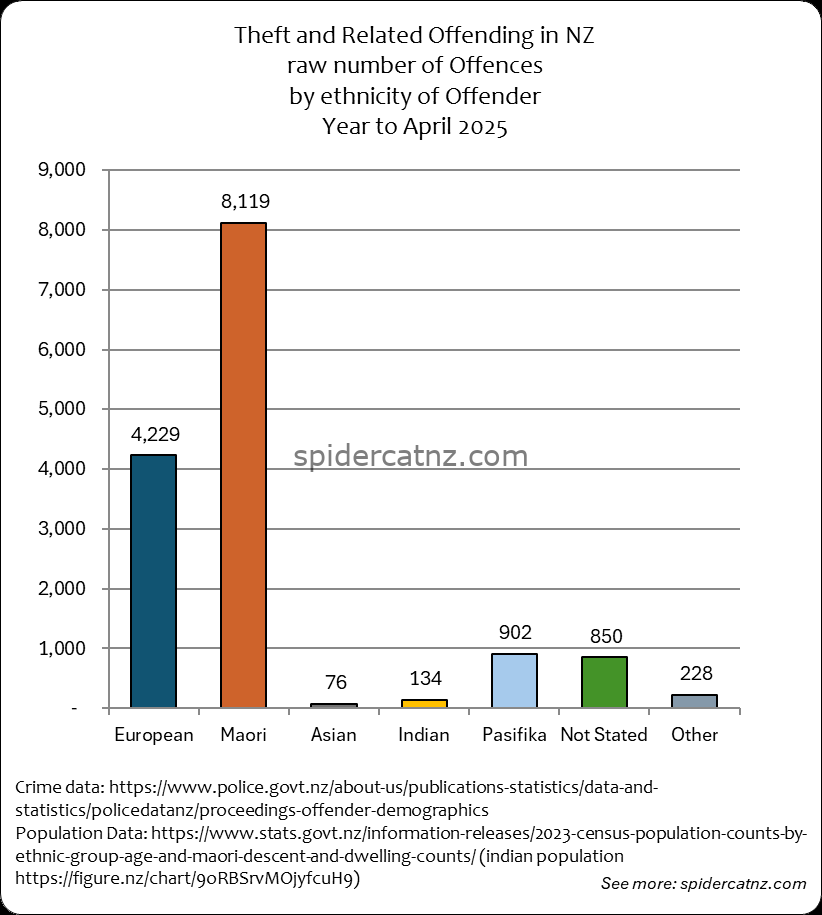
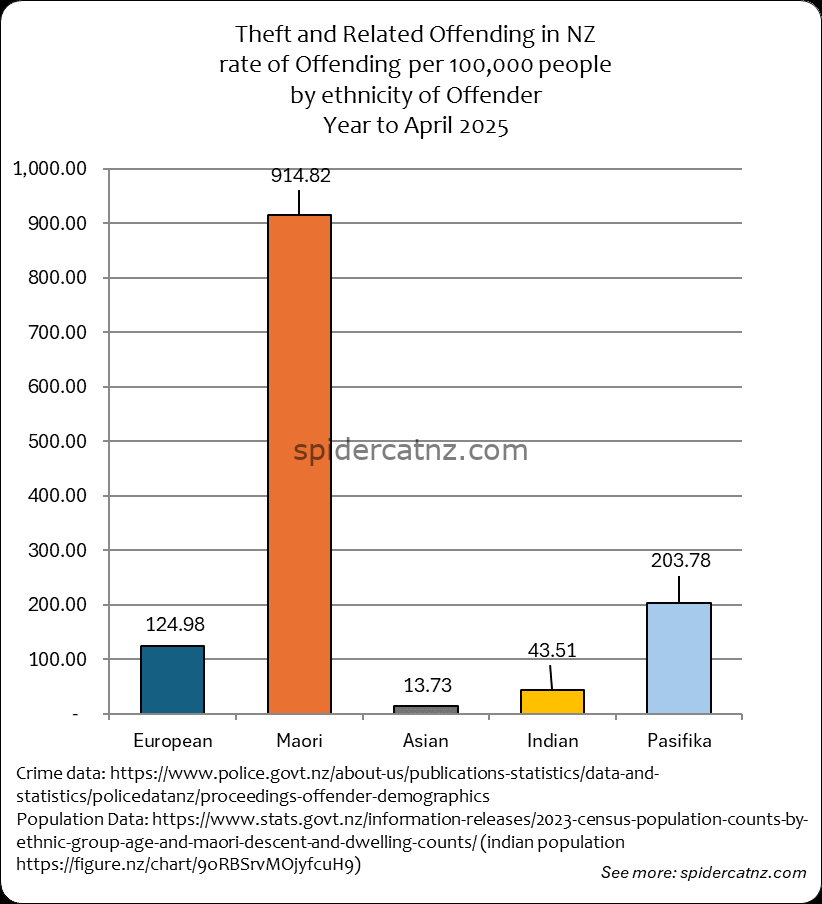
Theft Offending by Ethnicity
This graph shows all reported Theft crime where an offender was identified and proceedings were brought from May 2024 to April 2025, by ethnic group of the Offender:

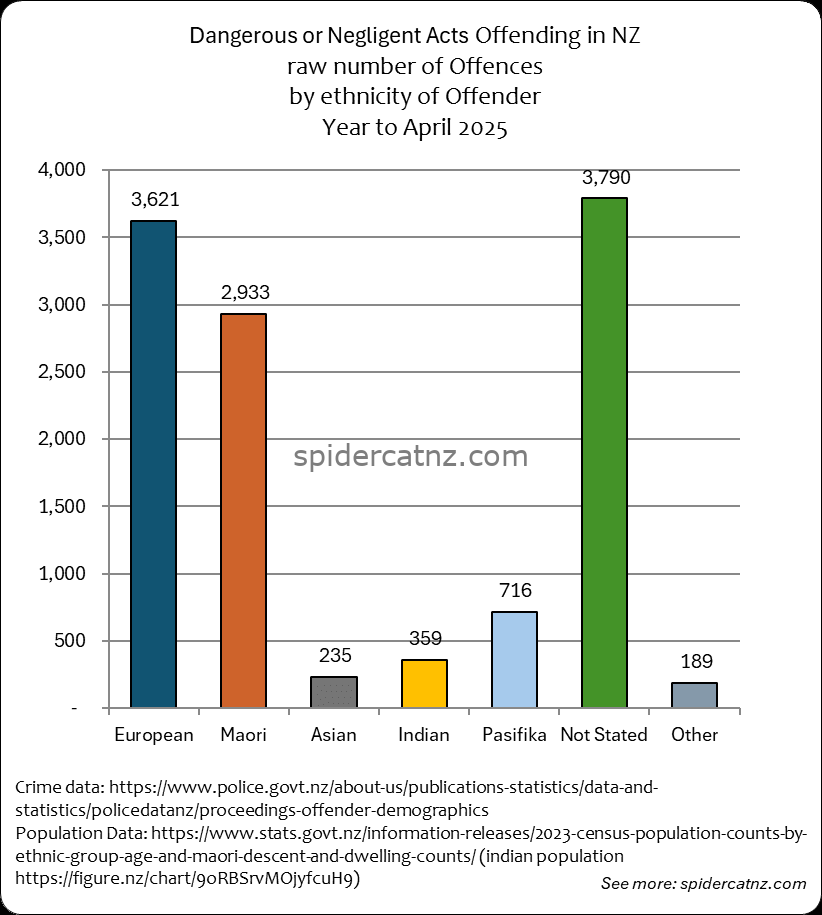
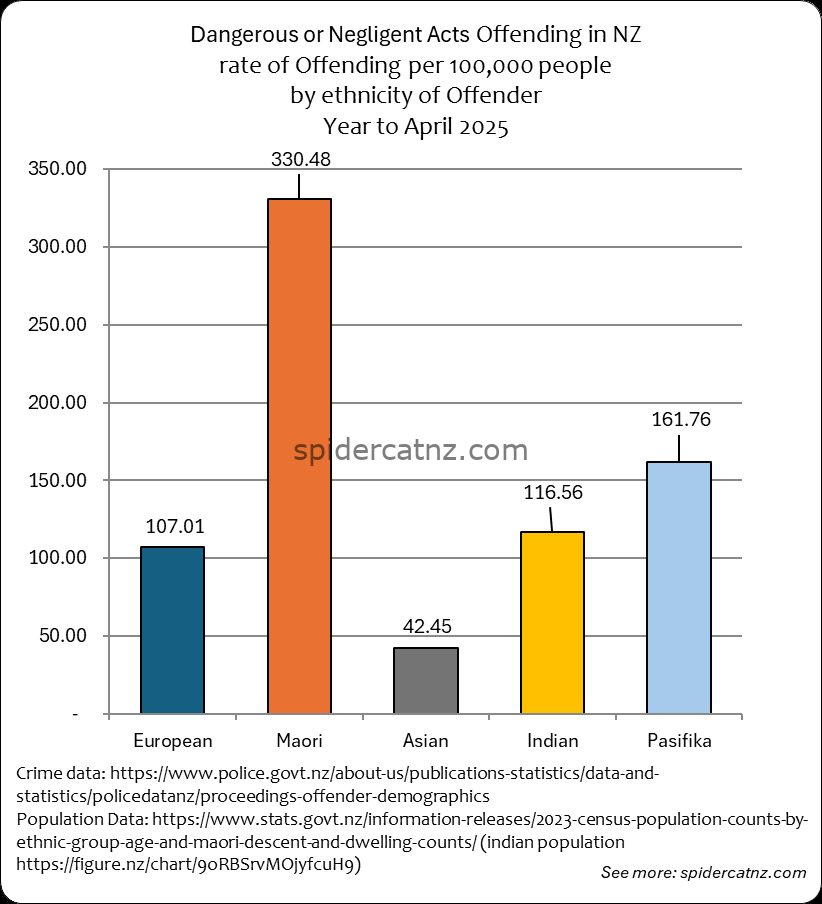
Dangerous or Negligent Acts Offending by Ethnicity
This graph shows all reported Dangerous or Negligent Acts Endangering Persons crime where an offender was identified and proceedings were brought from May 2024 to April 2025, by ethnic group of the Offender:
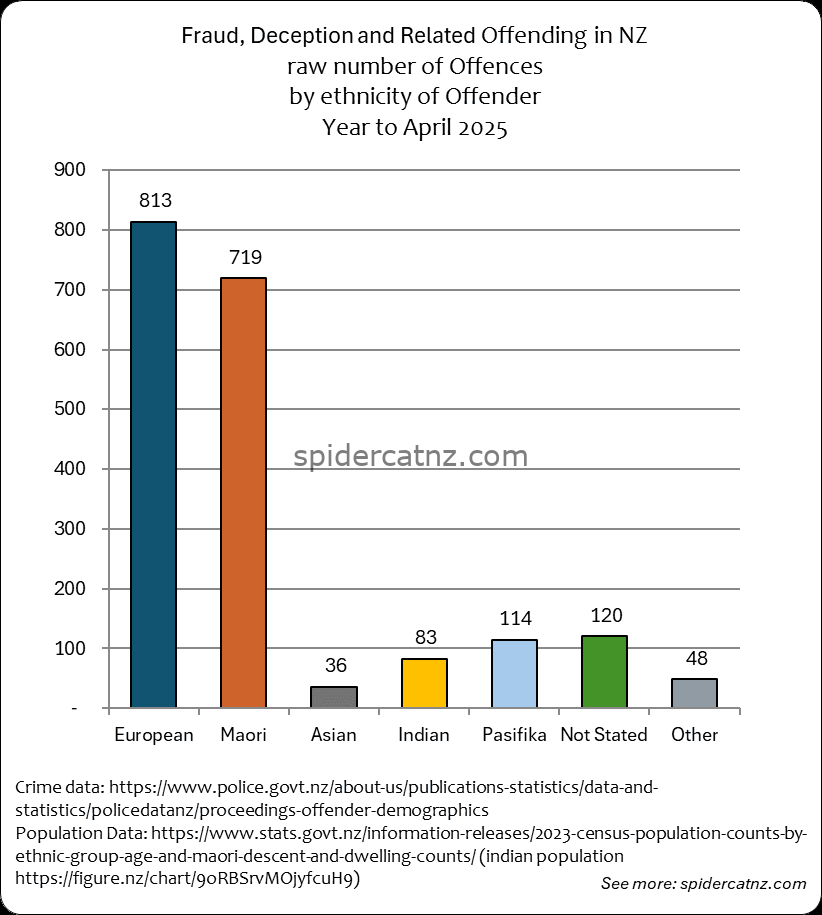
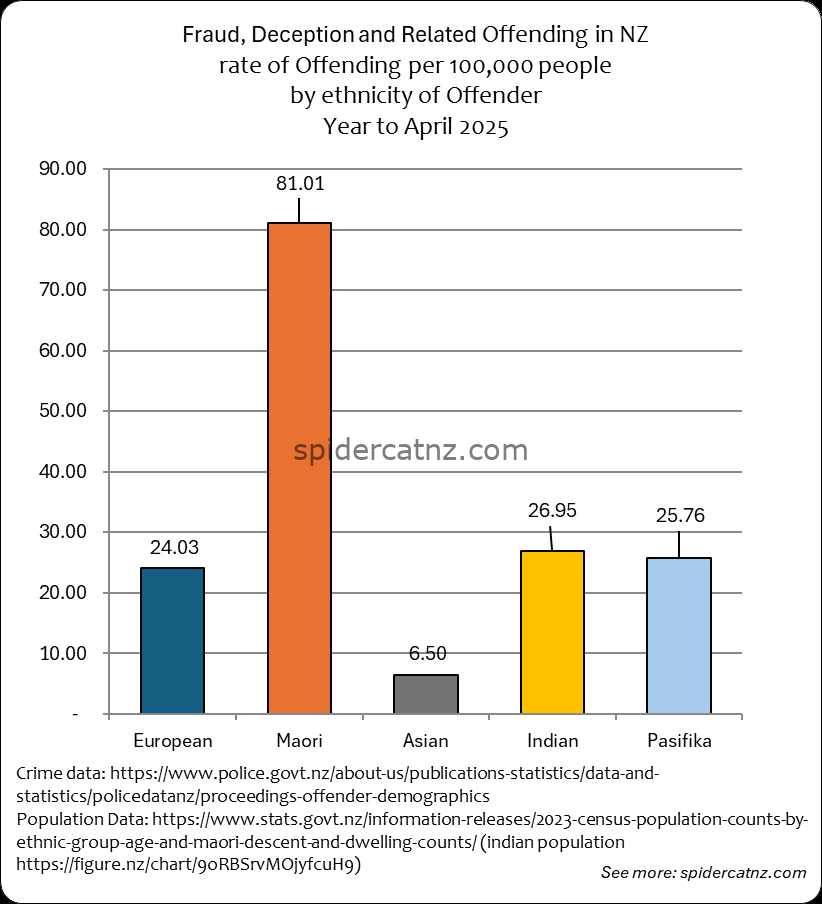
Fraud, Deception and Related Offending by Ethnicity
This graph shows all reported Theft crime where an offender was identified and proceedings were brought from May 2024 to April 2025, by ethnic group of the Offender:
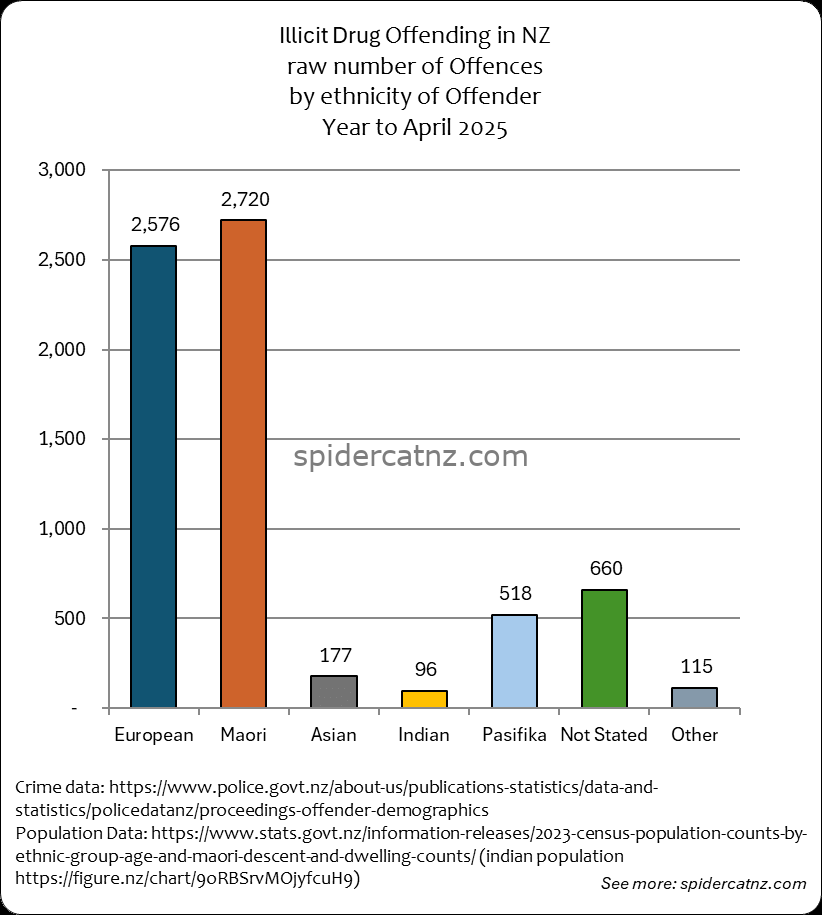
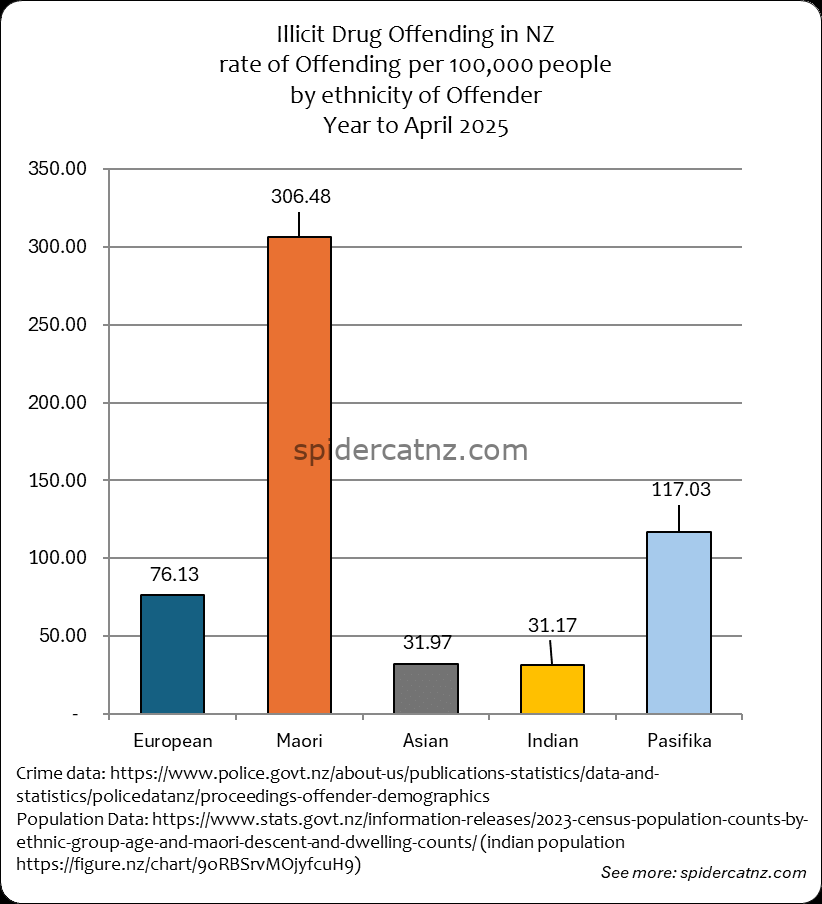
Illicit Drug Offending by Ethnicity
This graph shows all Illicit Drug Offending where an offender was identified and proceedings were brought from May 2024 to April 2025, by ethnic group of the Offender:

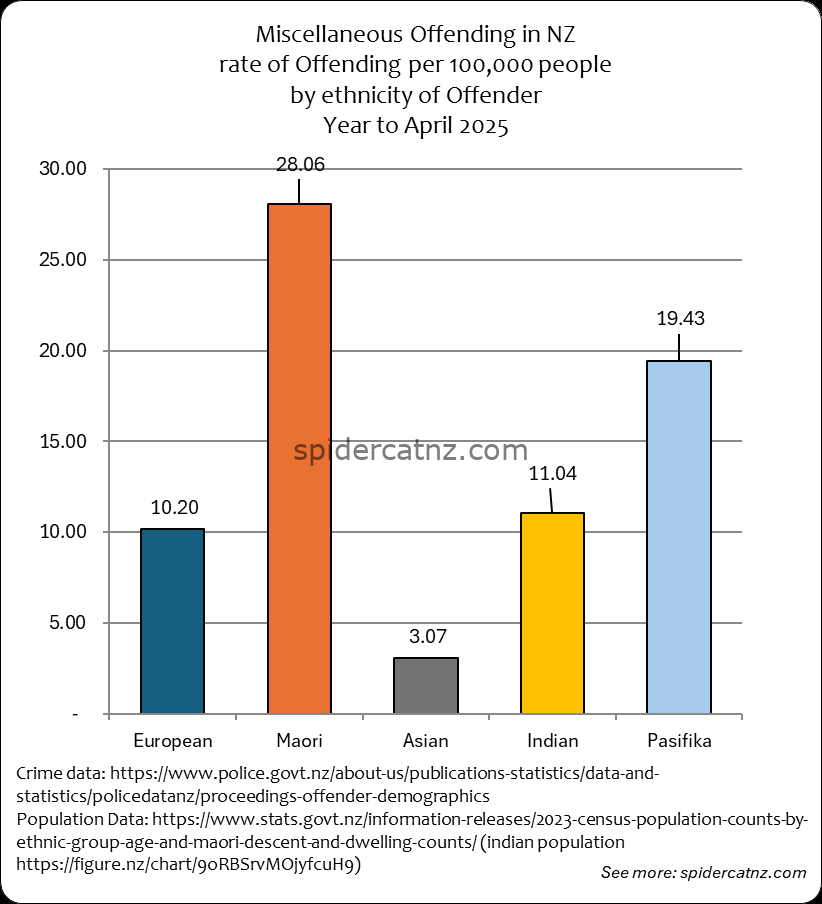
Miscellaneous Offending by Ethnicity
This graph shows all Miscellaneous Offending where an offender was identified and proceedings were brought from May 2024 to April 2025, by ethnic group of the Offender:

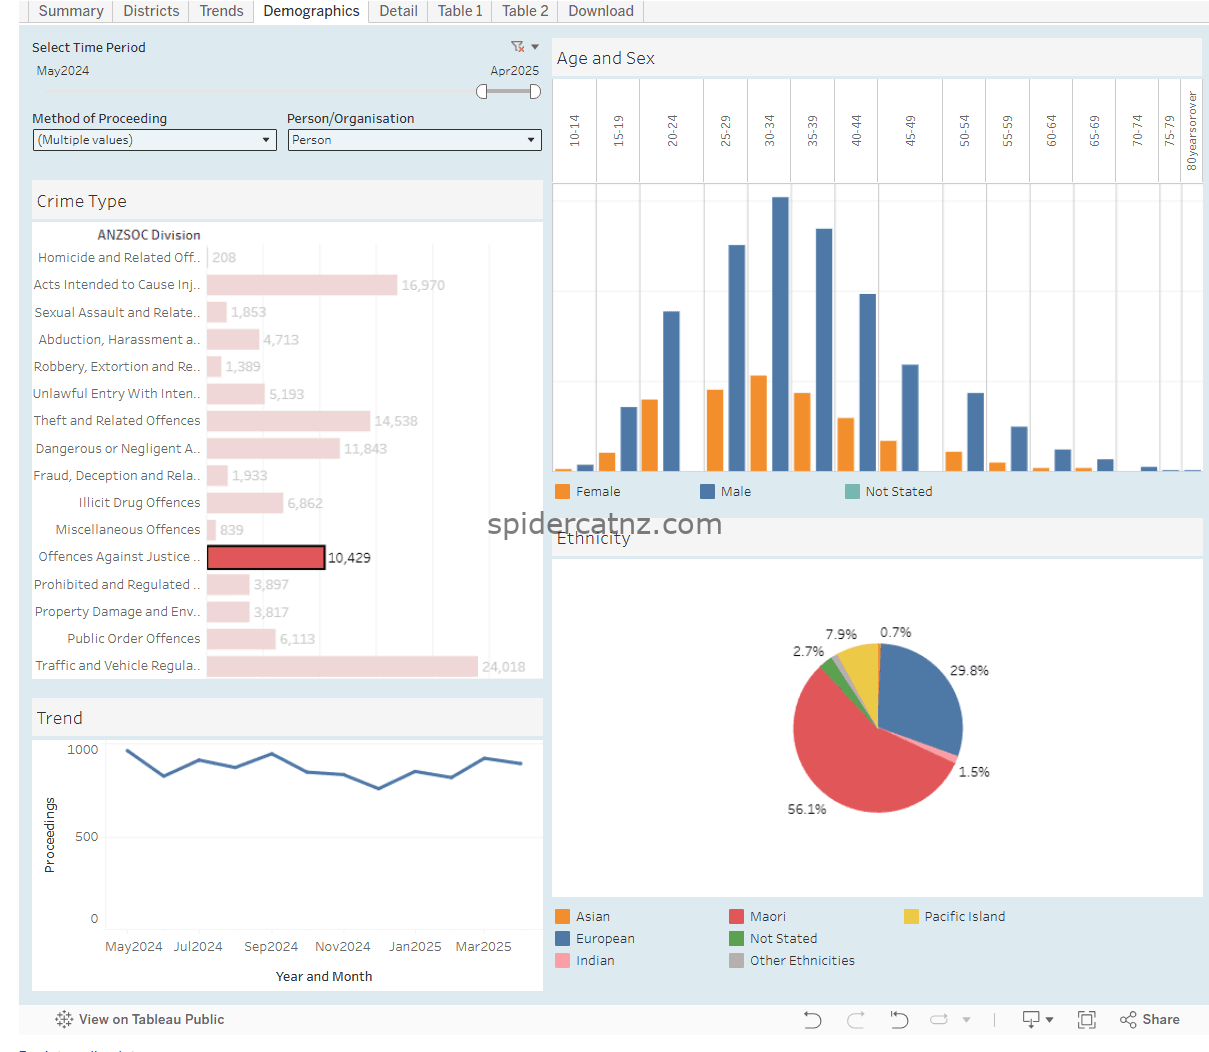
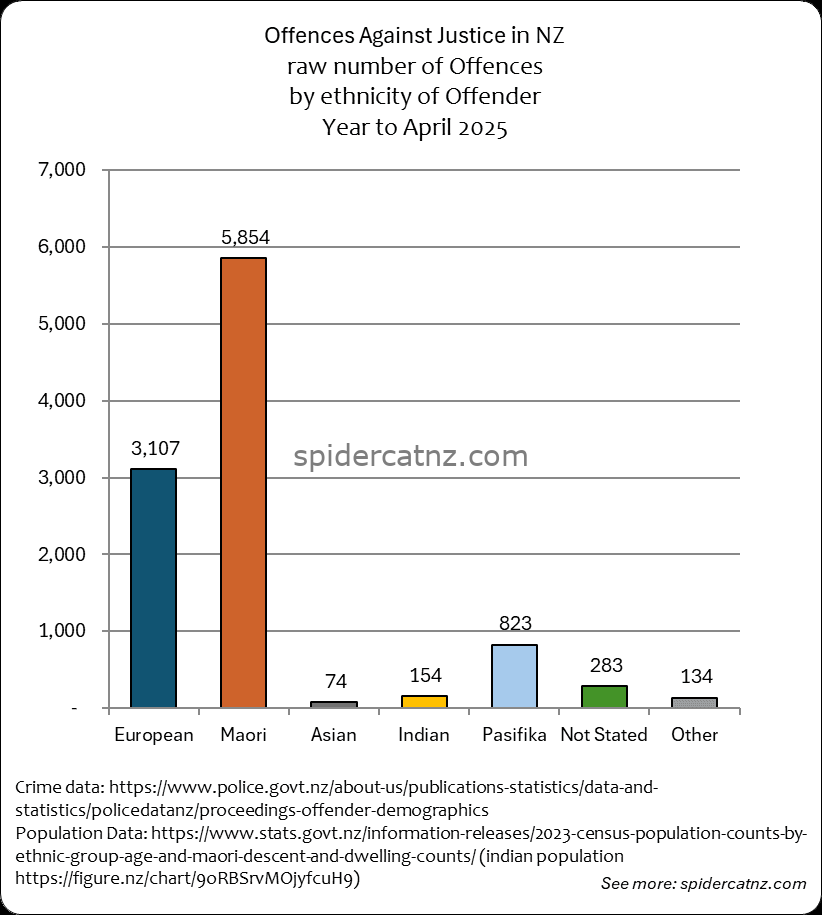
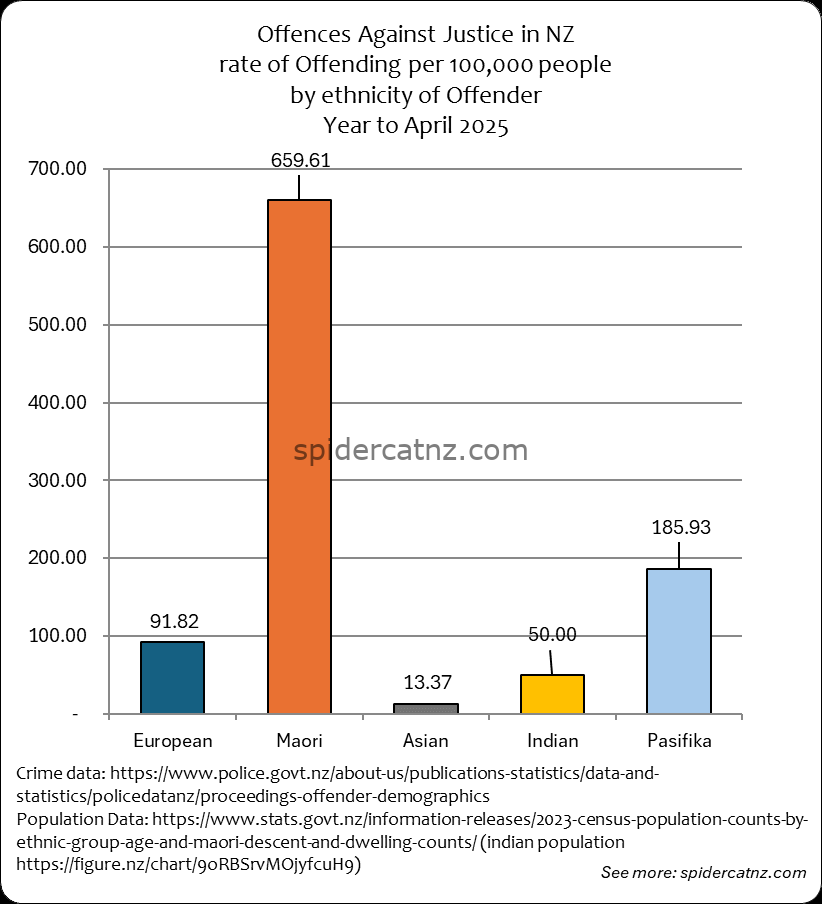
Offences Against Justice by Ethnicity
This graph shows Offences Against Justice where an offender was identified and proceedings were brought from May 2024 to April 2025, by ethnic group of the Offender:
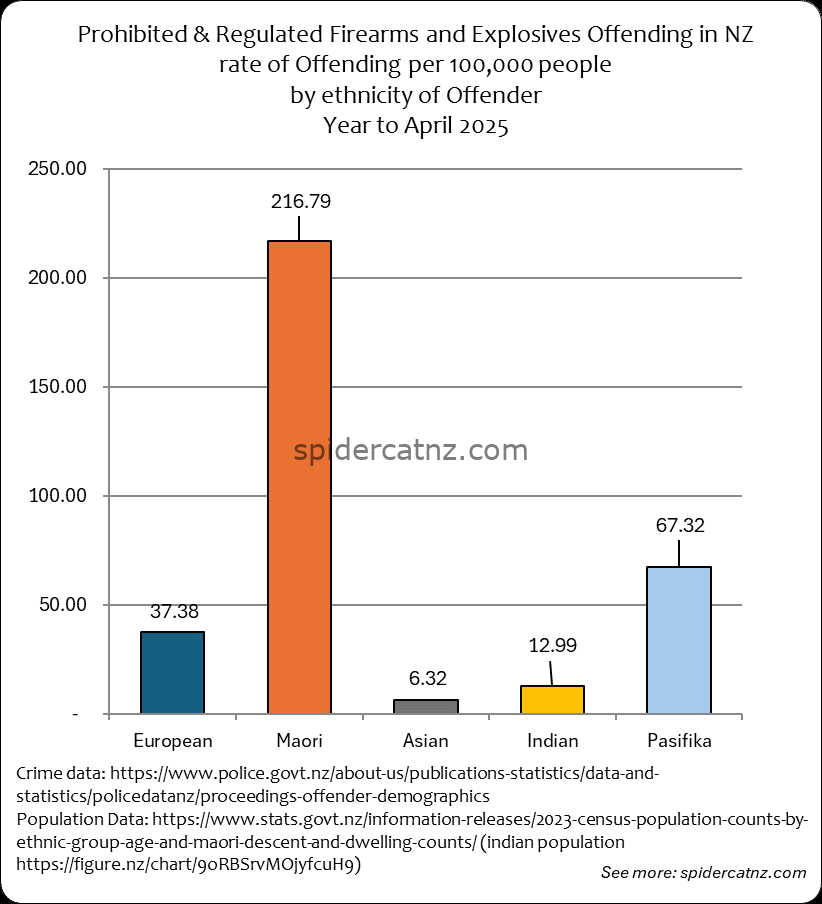
Prohibited and Regulated Firearms and Explosives Offending by Ethnicity
This graph shows all Prohibited and Regulated Firearms and Explosives Offending where an offender was identified and proceedings were brought from May 2024 to April 2025, by ethnic group of the Offender:

Property Damage and Environmental Pollution Offending by Ethnicity
This graph shows all Property Damage and Environmental Pollution Offending where an offender was identified and proceedings were brought from May 2024 to April 2025, by ethnic group of the Offender:


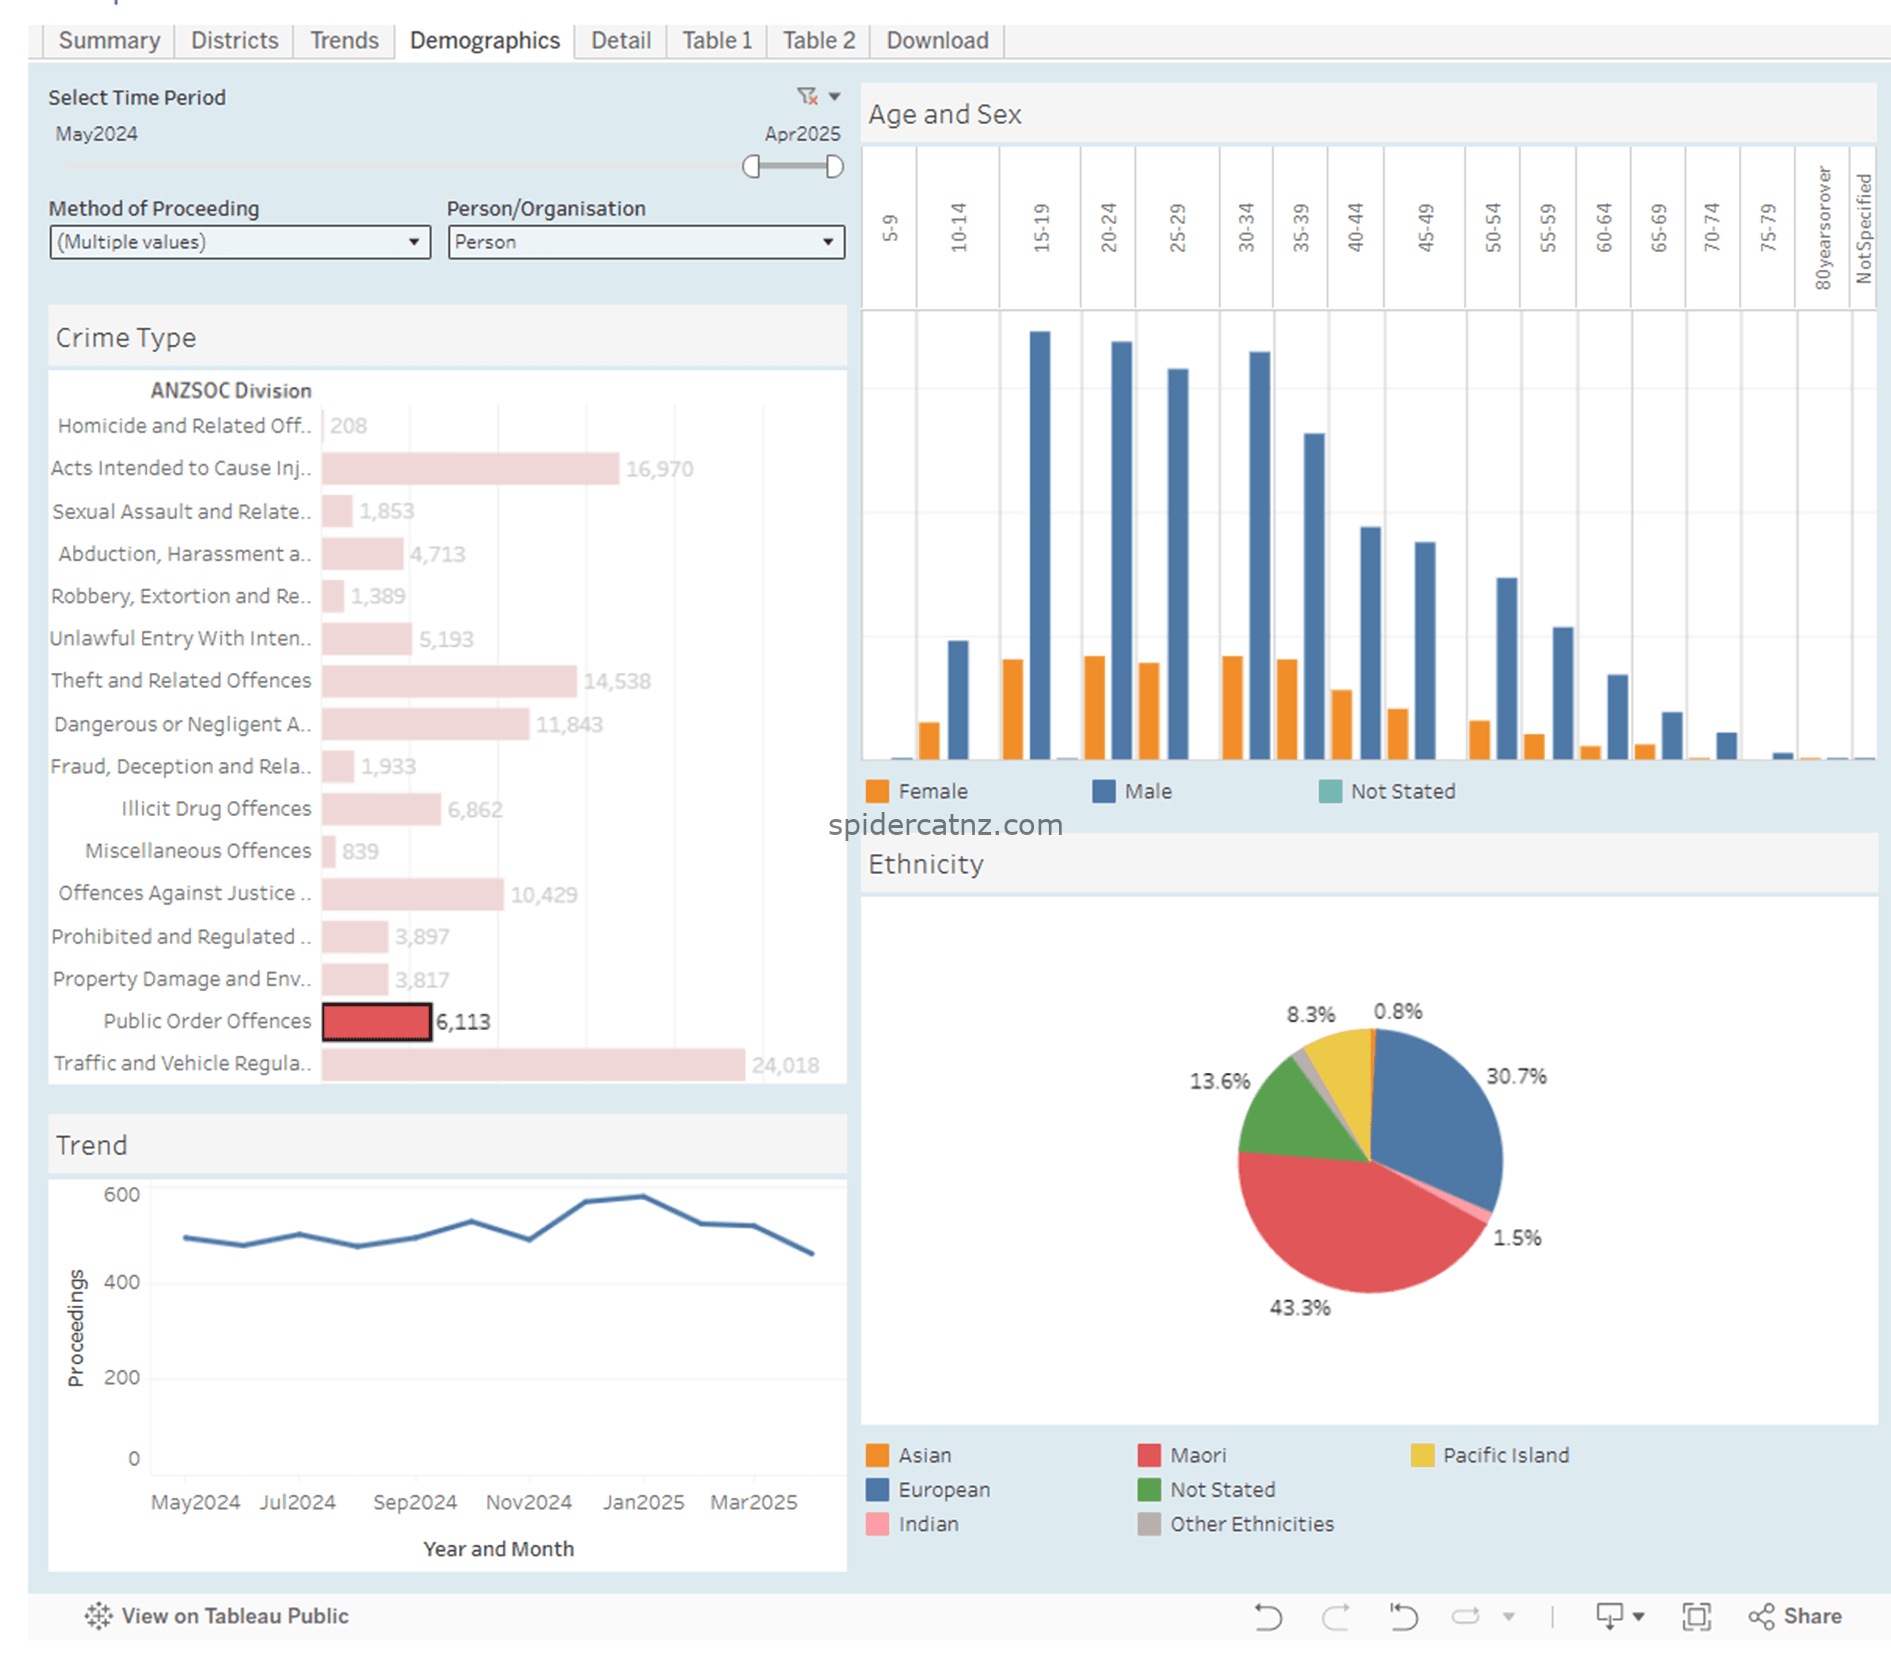
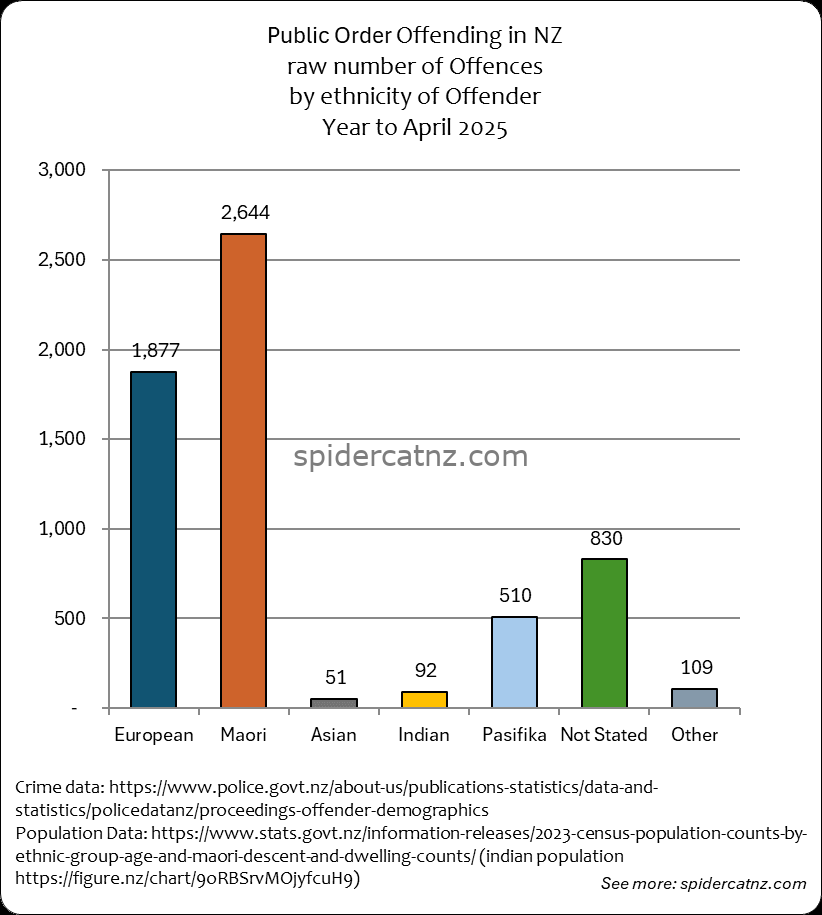
Public Order Offending by Ethnicity
This graph shows all Public Order Offences where an offender was identified and proceedings were brought from May 2024 to April 2025, by ethnic group of the Offender:
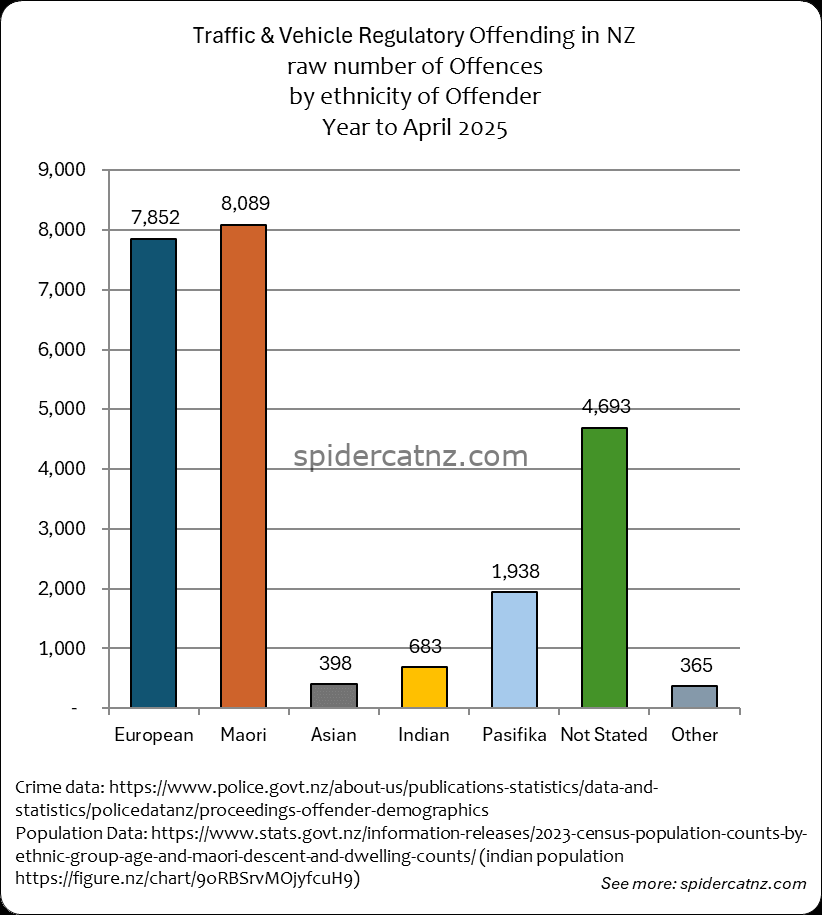
Traffic and Vehicle Regulatory Offending by Ethnicity
This graph shows all reported Traffic and Vehicle Regulatory crime where an offender was identified and proceedings were brought from May 2024 to April 2025, by ethnic group of the Offender:
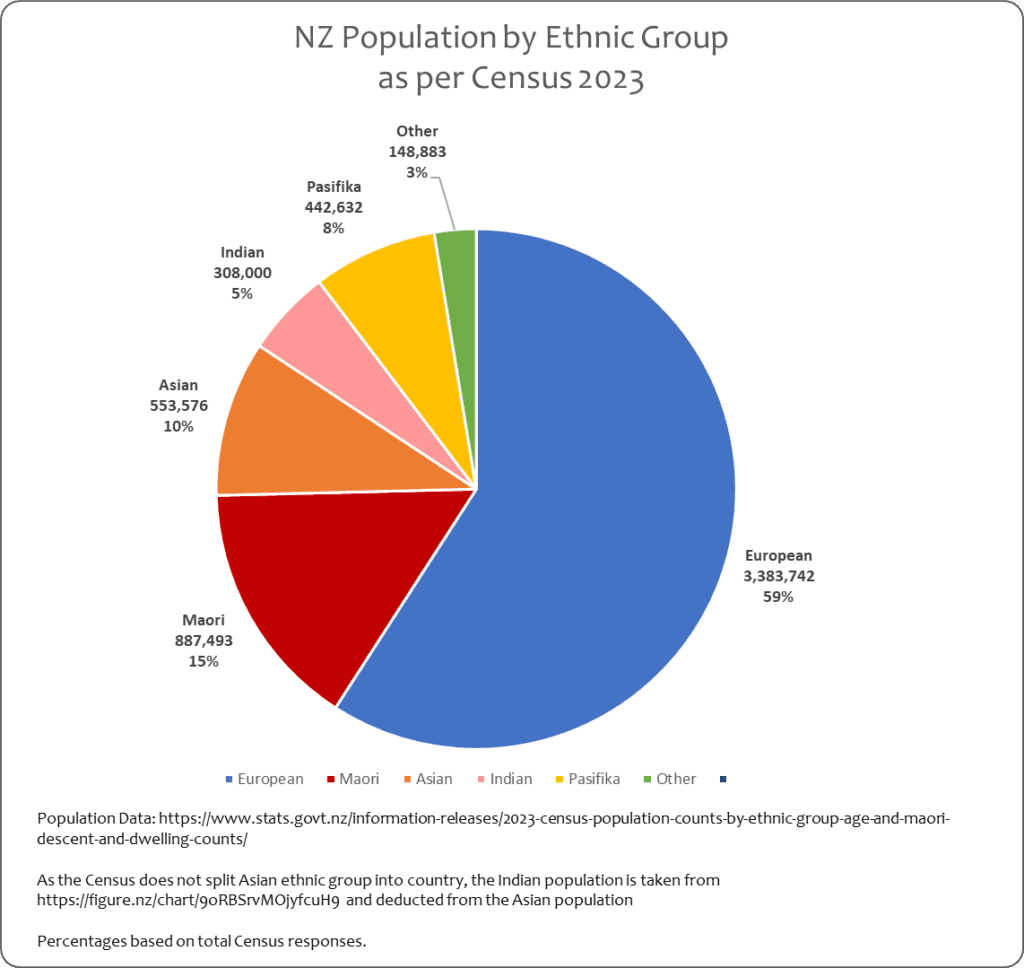
New Zealand’s Ethnic Makeup – 2023 Census
The ethnic group distribution of New Zealand as per the 2023 Census. This is a self-selected grouping in the Census, and where people have chosen more than one group, they are counted in each group. (It’s not a genetic thing, that wouldn’t be possible.)