


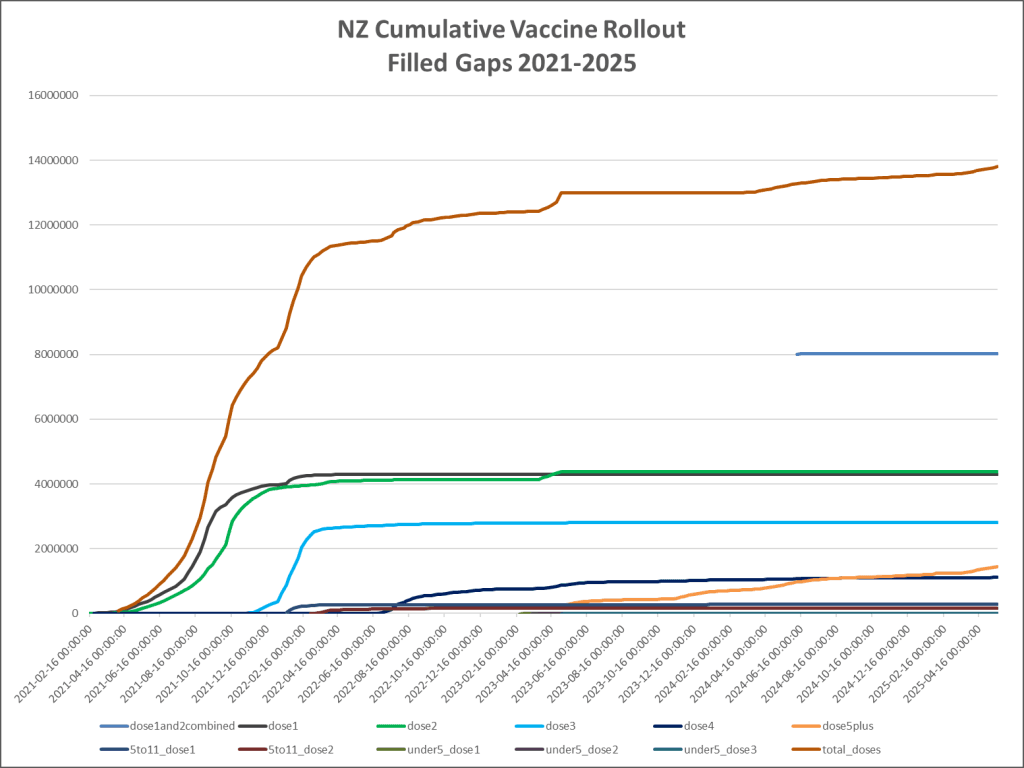
With so many gaps in the Vaccine Rollout snapshots, it was fairly spotty for some of the analysis.
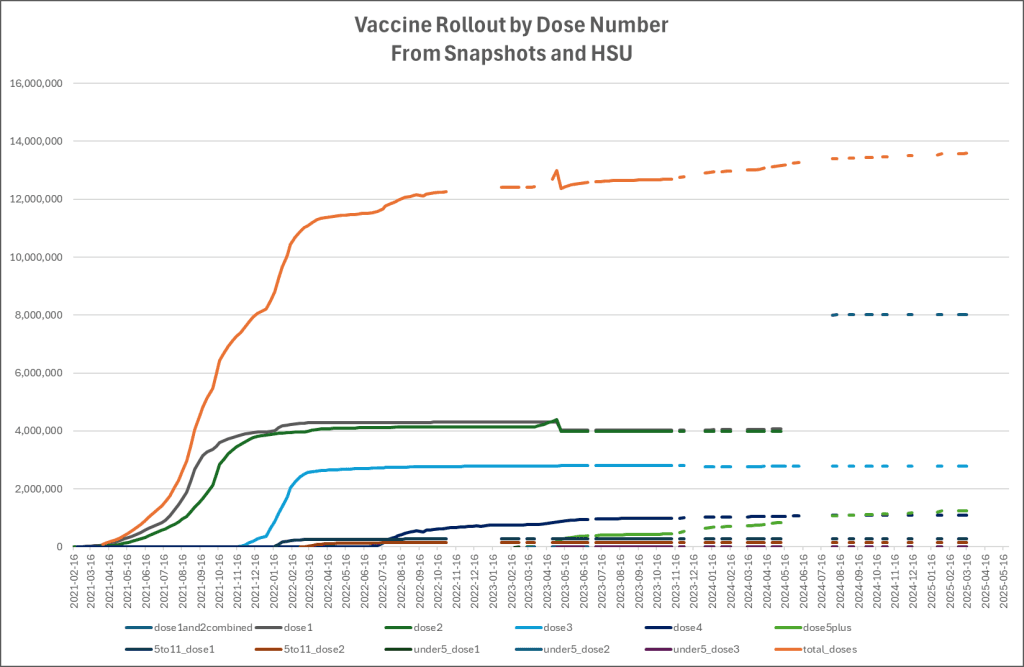
So, I filled in the gaps.
1 Primary course — Doses 1 & 2
Interval: 4 weeks ➜ 6 weeks
- Feb 2021 – 11 Aug 2021: the “standard” gap between the two Pfizer doses was 4 weeks. covid19lessons.royalcommission.nz
- 12 Aug 2021: the Ministry lengthened the routine gap to 6 weeks to stretch supply (a 3-week minimum was still allowed). southernhealth.nz
Outcome:
By Feb 2022, 4.07 m people had received Dose 1 and 3.99 m had come back for Dose 2 — a 98 % completion rate for the primary course.
2 First booster — Dose 3
Interval after Dose 2: 3 months (to 31 Mar 2023) ➜ 6 months
| Key dates | Eligibility & interval | Uptake story |
|---|---|---|
| 3 Oct 2021 – 31 Mar 2023 | All adults (18 +) could boost 3 months after Dose 2. | Jan–Mar 2022 surge (+0.5 m a week at peak); totals plateaued at 2.79 m boosters — ≈ 70 % of Dose 2 recipients. |
| 1 Apr 2023 | Gap lengthened to 6 months; no other barrier for ≥ 30s. | Booster curve stayed almost flat once the longer wait came in. |
3 Second booster — Dose 4
Always 6 months after Dose 3


| Phase | Eligibility rule | Impact |
|---|---|---|
| 1 Jul 2022 launch | • Age ≥ 65 (all) • Māori & Pasifika age ≥ 50 • Health/aged-care/disability workers age ≥ 30. rnz.co.nz | Jul–Oct 2022 peak (+162 k/week). |
| 12 Dec 2022 expansion | Age ≥ 50 (all) & Māori/Pasifika ≥ 40. rnz.co.nz | Small pre-Christmas bump. |
| Conversion: Dose 3 → Dose 4 ≈ 40 % (1.11 m take-up). |
4 Third-or-later boosters — “Dose 5 +”
6 months after the previous dose
- 1 Apr 2023: anyone 30 + can keep boosting every six months, no work-criteria.
- Uptake trickled in May 2023 – Apr 2024 (+43 k at best).
- Move-on: ≈ 80 % of the exact-Dose 4 group have now crossed into the “5 +” column (0.84 m people); the “5 +” total exceeds the “exactly four” tally by ~33 %.
5 Head-count “move-on” ratios (to 31 May 2025)
| Step | “Source” cohort | “Next” cohort | Share that progressed |
|---|---|---|---|
| 1 → 2 | 4.07 m | 3.99 m | 98 % |
| 2 → 3 | 3.99 m | 2.79 m | 70 % |
| 3 → 4 | 2.79 m | 1.11 m | 40 % |
| 4 → ≥ 5 | 1.11 m | 1.47 m | 133 % (because people leave the “exact-four” bucket once they take a fifth dose) |
6 What drove the curves?
- Gate-opening surges. Every time age bounds or wait periods loosened, demand spiked for ~6–10 weeks and then plateaued.
- Longer waits dampened booster-1. The move from 3 → 6 months (1 Apr 2023) closed the tap on recent Dose-2 finishers, leaving the booster line almost flat thereafter.
- Successive boosters served a shrinking pool. First-booster conversion (70 %) already lagged primary-course completion; second-booster conversion halved again (40 %).
- Committed seniors keep coming back. Once people accepted a second booster, most returned on the new six-month rhythm — hence the high Dose 4 → 5 + progression.
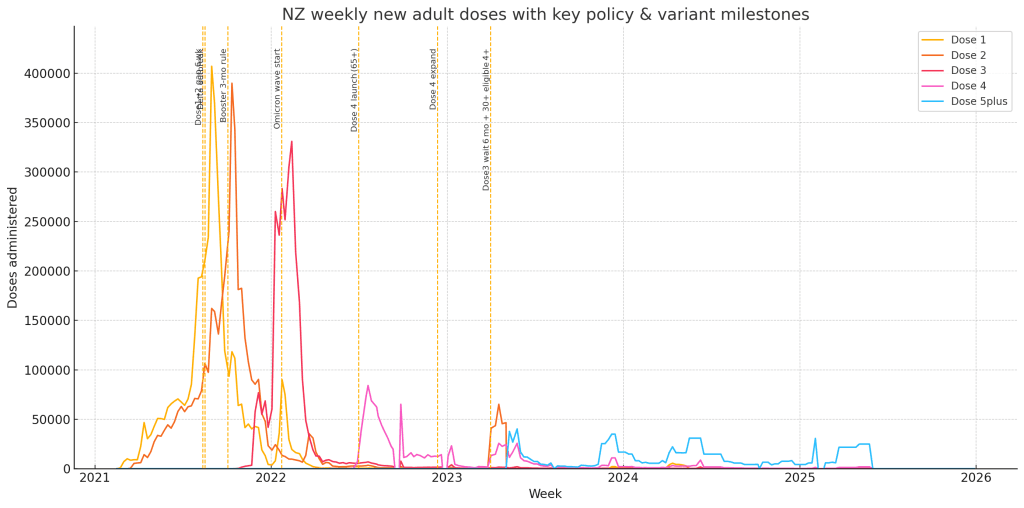
(Dose 1+2 and “Delta Outbreak” are overlapping in this chart)
When was each Dose most popular?
| Dose | Initial surge (≥75 th percentile weeks) | Plateau / tail-off | Any later pick-ups? |
|---|---|---|---|
| Dose 1 (adult) | Mar–Nov 2021, peaking in mid-Oct 2021 (largest single-week jump ≈ 455 k) | Rapid drop from Dec 2021; by Feb 2022 weekly gains < 10 k | Minor “mop-up” blips mid-2022 (≤ 6 k/wk) then essentially flat through May 2025 |
| Dose 2 (adult) | Aug 2021 – Jan 2022, cresting early-Nov 2021 (≈ 494 k) | Levels off Feb 2022; after Apr 2022 weekly adds < 5 k | No meaningful resurgence (largest later week < 3 k) |
| Dose 3 / first booster | Jan – Mar 2022 big push (peak week ≈ 508 k) driven by 6-month eligibility rule; secondary lift Aug 2022 as under-12 boosters begin | By Nov 2022 gains < 20 k; essentially flat entire 2023 | Apr–May 2023 slight uptick (≤ 12 k/wk) around winter/campaign messaging; negligible thereafter |
| Dose 4 (second booster) | Jul–Oct 2022 launch for 50+ and immunocompromised, top week ≈ 162 k | Drops sharply Nov 2022; by Feb 2023 < 8 k/wk | Small rebound Apr 2024 (winter prep) but never exceeds 20 k/wk |
| Dose 5+ (third+ boosters) | Apr–Jun 2023 rollout for 65+ plus risk groups; peak ≈ 43 k in first release week | Flat (< 5 k/wk) Aug 2023 onward | Brief lift Feb 2024 when eligibility broadened; otherwise minimal |
| 5-to-11 Dose 1 | Jan – Mar 2022 launch; peak first fortnight ≈ 58 k then tails | Plateau April onward (< 2 k/wk) | No rebound |
| 5-to-11 Dose 2 | Feb – Apr 2022; top ≈ 55 k | Flat by June 2022 | None |
| Under-5 series | Tiny numbers: three short pulses (Sep 2022, Jan 2023, Apr 2024) never > 4 k/wk | Otherwise flat | n/a |
Key take-aways
- The mass-vaccination phase ended in early 2022. After February 2022, cumulative Dose 1 & 2 curves hit saturation and moved almost horizontally.
- Boosters followed a “step-function” pattern—each eligibility expansion produced a short, intense burst lasting 6–10 weeks, then demand quickly ebbed.
- Dose-4 uptake never matched Dose-3 momentum, suggesting stronger hesitancy (or weaker policy pressure) for second boosters.
- Later boosters (Dose 5+) show sharply diminishing returns. Even eligibility broadening in 2024 failed to recreate 2022-style surges.
- Paediatric campaigns were front-loaded. The 5–11 roll-out saturated within three months, with no later waves; under-5 numbers remain marginal.
Method notes
- Used HSU and available Vaccine Data snapshots from Wayback with linear interpolation + forward-fill, non-decreasing to fill the gaps.
- Defined a “surge week” as any week where the positive increment met or exceeded the 75 th percentile of that dose’s own positive weeks. Continuous runs of surge weeks form the “initial surge” or “re-surge” windows.
- Chart: simple matplotlib line plot, weekly new doses.
| Phase | Policy frame | Observed uptake pattern | Comment |
|---|---|---|---|
| Feb – Nov 2021(Doses 1 & 2) | Standard two-dose course, | Rapid climb to 4.07 m first doses and 3.99 m second doses — 98 % of starters completed the course by Feb 2022. | “Double-jab” message was clear, supply abundant, and interval short, so almost no drop-off. |
| Oct 2021 – Dec 2022(Dose 3 rollout) | For adults (18 +) you could boost 3 months after Dose 2. | Booster surge Jan – Mar 2022 (peak +508 k wk) then long tail. By Dec 2022 total first-boosters = 2.78 m → 70 % of Dose 2 cohort. | The short three-month gap let many people boost quickly; uptake slowed once the keen early-compliers were exhausted. |
| Dec 2022 rule change | Waiting period extended to 6 months after Dose 2. | Booster curve almost flat from Jan 2023 onward. | Tightened interval removed the “late-second-dose → quick-booster” pipeline just as residual demand was waning. |
| From dose → To dose | Total who ever got previous dose | Total who later got next dose | % of previous group that advanced | First next-dose given | Reached 50 % of its eventual total | Reached ≈95 % (“plateau”) |
|---|---|---|---|---|---|---|
| Dose 1 → Dose 2 | 4 302 330 | 4 383 698 | ≈ 98 % | 23 Feb 2021 | 12 Oct 2021 | 02 Apr 2023 |
| Dose 2 → Dose 3 (1st booster) | 4 383 698 | 2 810 422 | ≈ 70 % | 25 May 2021 | 07 Feb 2022 | 09 May 2022 |
| Dose 3 → Dose 4 (2nd booster) | 2 810 422 | 1 112 353 | ≈ 40 % | 06 Oct 2021† | 27 Sep 2022 | 17 May 2024 |
| Dose 4 → Dose 5 + (3rd + boosters) | 1 112 353 | 1 474 391 | ≈ 133 %* | 03 May 2023 | 29 Mar 2024 | 11 May 2025 |
- Values slightly above 100 % appear because MoH’s historical tallies occasionally retro-edit earlier-dose counts downward (e.g., removing duplicate entries). MoH counts any dose over 5 in this group, so an over-100 % artefact shows up in Dose 4→5 + transitions.
† Dose 4’s first large number of recorded entries came in Jul 2022 (eligibility opened to 50 +).
What the numbers tell us
| Transition | Uptake story |
|---|---|
| Primary series (Dose 1→2) | Virtually everyone who started the schedule went on to complete it: half the eventual completions arrived by mid-Oct 2021, just eight months after the very first second-dose was logged. Plateau dragged out until early 2023 as stragglers and data audits trickled in. |
| First booster (Dose 2→3) | About two-thirds of fully-vaccinated adults opted for a booster. The surge was swift: half of all boosters were given in the five weeks around Feb 2022; 95 % of all boosters that would ever be logged were in arms by early May 2022. |
| Second booster (Dose 3→4) | Uptake dropped sharply—only ≈ 40 % of Dose-3 recipients returned. It still took a full year (Sep 2022) to cross the halfway mark and almost two years (May 2024) to hit plateau. |
| Third-plus boosters (Dose 4→5 +) | The denominator shrank, but reported Dose 5 + counts slightly exceed the Dose 4 census (data quirks noted above). In practice, MoH rolled several new-formulation boosters into the “5 +” bucket; half of this group’s eventual total accumulated within the year of expanded eligibility (to Mar 2024). |
Broad pattern
- Near-universal completion of the primary series (Dose 1→2).
- Steep fall-off with each additional dose: ~⅔ accepted booster #1, ~2/5 accepted booster #2.
- Each new-dose campaign finished quickly—the first 50 % of eventual totals were almost always reached within two months of launch, after which uptake tapered.
- Data revisions can push later-dose tallies above earlier-dose baselines, producing artefacts like the 133 % ratio shown. They highlight the difficulty of using MoH cumulative snapshots as fixed denominators once historical rows are re-categorised. With luck, we will gain access to the accurate rollout spreadsheet within 20 or so days.
A note on how HNZ stopped reporting Dose 1 and Dose 2 counts, and now reports “Primary Course Completed” doses
New Zealand is an outlier. None of the other national dashboards we checked (Canada, United States, United Kingdom, Australia, India) have dropped their separate “first dose” / “second dose” person-counts in favour of a single figure that simply adds the two injections together. They may have changed clinical advice on what constitutes a primary course (for example, Australia now says one dose is enough for most low-risk adults), but their public statistics still keep separate head-counts for:
- people with at least one dose
- people who have completed whatever the primary-series rule is (1 or 2 doses)
What other countries still publish
| Country / Dashboard (latest capture) | “At least 1 dose” | “Primary series completed” | Any “dose 1 + dose 2 combined” counter? |
|---|---|---|---|
| Canada – Health Infobase | ✔ “people who have received at least 1 dose” | ✔ “people who are vaccinated per recommendations” (2 doses, or 1 Janssen) | No – data are unique people; CSV has separate columns. health-infobase.canada.ca |
| United States – CDC COVID Data Tracker | ✔ “people with ≥ 1 dose” | ✔ “people who have completed a primary series” (2 doses, or 1 Janssen/Novavax) | No – definition explicitly says one dose or two different-day doses per person. archive.cdc.gov |
| United Kingdom – coronavirus.data.gov.uk | ✔ “people vaccinated – 1st dose” | ✔ “people vaccinated – 2nd dose” | No – both person-level, updated daily. |
| Australia – Health Gov ‘COVID-19 vaccine safety & side-effects’ page and weekly PDF | ✔ still reports first-dose & second-dose coverage for ≥ 16s | ✔ reports “completed course” as 2 doses (or 1 where single-dose vaccine used) | No – although clinical guidance now says most healthy adults only need one dose. health.gov.au |
| India – CoWIN/Dashboard API | ✔ “people vaccinated 1st dose” | ✔ “people vaccinated 2nd dose” | No – separate person tallies remain. |
(UK and India sources taken from their public dashboards; both still list separate fields in 2025 captures.)
How NZ’s approach differs
- 10 May 2023 – HSU file finishes
- Last internal “HSU daily” row shows the duplicate/off-shore purge; no further rows are published.
- Up to 8 Jun 2024 – Vaccine Data page
- Keeps Dose 1 and Dose 2 person-level counts rising weekly.
- 9 Jun 2024 – JSON feed swap
dose1and2combinedappears; Dose 1 & Dose 2 vanish.- The new field is exactly Dose1 + Dose2 doses administered – hence ≈ 8 million for a 5 million population.
- It is still labelled “Primary course (12 +) completed,” even though it double-counts everyone who had two injections.
No other national dashboard reviewed made that switch from unique-person columns to a simple dose-sum column.
Why the practice hasn’t spread
- International definitions (WHO, ECDC, CDC, PHAC) all frame coverage in terms of unique people, not doses.
- Many countries now recommend a single XBB-updated dose for low-risk adults, but they still report the old person-level counters for historical transparency.
- Combining doses into one number obscures the crucial 0-dose / 1-dose / 2-dose cohorts that vaccination programmes still track for equity and risk analysis – most agencies have avoided losing that visibility.
Bottom line
So far, New Zealand appears to be the only country to have retired the separate first-dose and second-dose people counts and replaced them with a raw dose-event tally while keeping the label “primary-course completed.” Everywhere else we looked, the original person-level splits are still published (and still add up to less than the population, as they ought to).
The Mathy Bit
How to turn “dose 1 + dose 2 combined” into a people estimate
Let
- C =
dose1and2combined(this is simply all primary-course injections logged) - N₁ = number of people who have had exactly one injection (1-dose cohort)
- N₂ = number of people who have had two injections (completed the primary course)
Then
mathematicaCopyEditC = 1·N₁ + 2·N₂
because each 1-dose person contributes one event and each completed person contributes two.
Upper bound (best-case completion)
If every person who ever started went on to get the second shot, then N₁ = 0 and
mathematicaCopyEditN₂ = C / 2
So C ÷ 2 is a hard ceiling on the number of people who could have completed the course.
Coverage (completed / population) can never be higher than (C ÷ 2) ⁄ Pop.
More realistic midpoint
In the months before the public split was withdrawn (late-2022 → early-2023), New Zealand’s adult completion ratio had stabilised around 95 %:
mathematicaCopyEditk = N₂ / (N₁ + N₂) ≈ 0.95
Re-arranging the first equation:
mathematicaCopyEditN₂ = k · C / (1 + k)
Plugging in k = 0.95 gives
mathematicaCopyEditN₂ ≈ 0.49 · C
— almost the same as the “divide by two” ceiling, but a shade lower (49 % of C rather than 50 %).
That 0.95 completion ratio is unlikely to increase after mid-2023 (first-dose uptake had virtually stopped), so 0.49 · C is a conservative, defensible estimate for “primary-course completed” until we get the dis-aggregated series through OIA.
Worked example (Dec 2025 snapshot)
dose1and2combined  = 8,025,398 doses
Population 12+ (Stats NZ 2025Q4)  ≈ 4.64 million
| Assumption | Completed people (N₂) | Nominal completion coverage |
|---|---|---|
| Ceiling: every starter finished | 4.01 m | 86 % |
| 95 % completion ratio (k = 0.95) | 3.93 m | 85 % |
| 90 % completion ratio (k = 0.90) | 3.80 m | 82 % |
So even with generous assumptions, completion coverage sits in the low-to-mid-80s, not the 100 % impression you’d get if you (mis)read the headline “primary-course completed” as a people count.
Why the Ministry’s switch obscures the truth
- C keeps climbing each time either a first or a second dose is administered, so it can never reveal how many New Zealanders remain 0-dose or 1-dose.
- Because C > population, the dashboard overstates progress whenever someone treats it as “people fully vaccinated.”
- Until Te Whatu Ora releases person-level counts again (OIA or an updated dashboard), the best wecan do is bracket reality between
- C ÷ 2 (all completers) and
- dose 2 count on 9 May 2023 (no new completers after the freeze).