


Over the course of 2021 and 2022, New Zealand’s COVID-19 vaccination campaign was shaped by more than just availability — it was shaped by messaging, mandates, and momentum. The age-stratified data from Health New Zealand’s internal dose schedule, recently obtained via OIA, allows us to see how that played out.
🧒 Teens and Young Adults (12–29)
This age group includes two very different populations — school students and socially active young adults — but both faced significant pressure to get vaccinated.
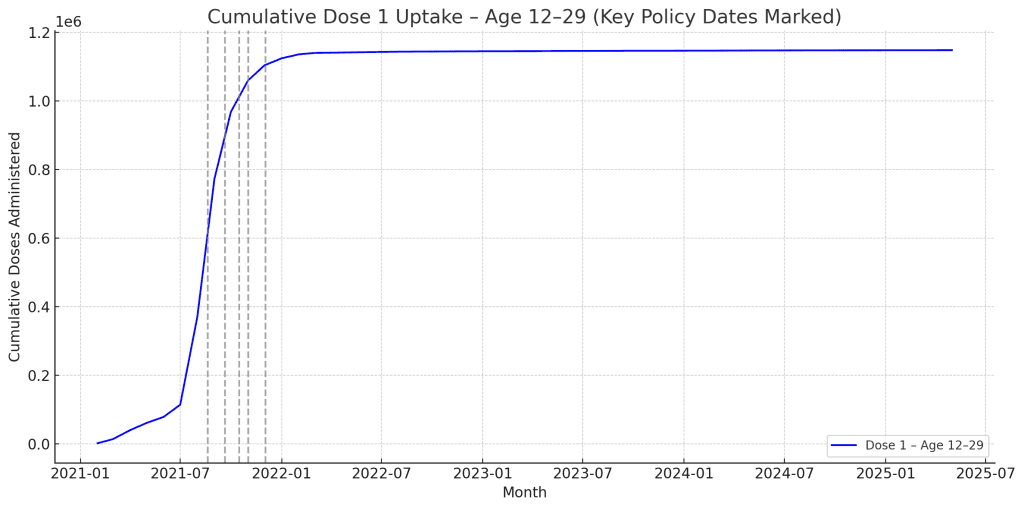
- Dose 1 uptake surged between September and December 2021, coinciding with:
- Government messaging about vaccine passes and “earning your summer.”
- Event and venue restrictions.
- School-level requirements for sports and activities.
- A clear upward bend in the curve appears after “Super Saturday” (October 16) and flattens sharply after the summer of 2021–22.
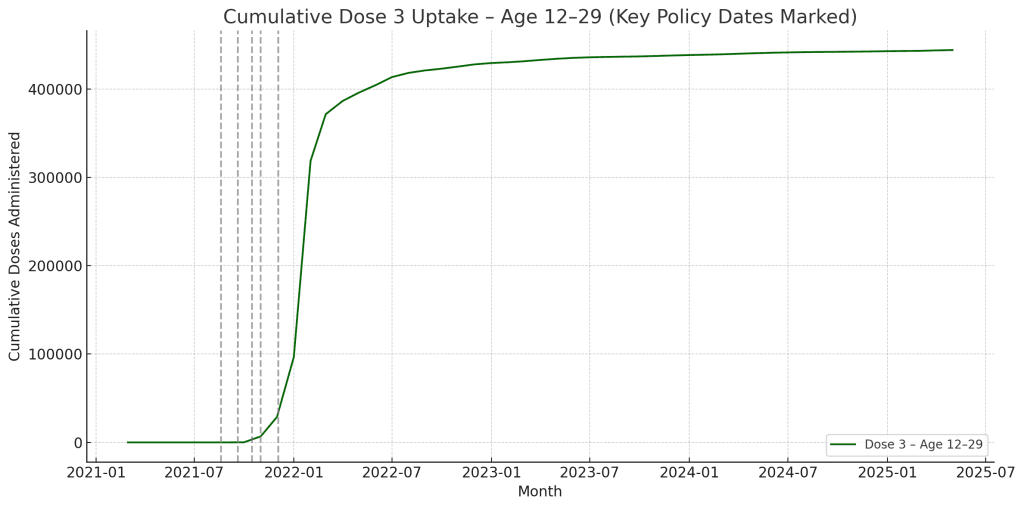
When it comes to Dose 3, however, things look different. The same group took boosters quickly when they first became eligible, but uptake stalled almost completely after the first wave. Many who complied with the initial push didn’t return.
🧒 Children (0–11)
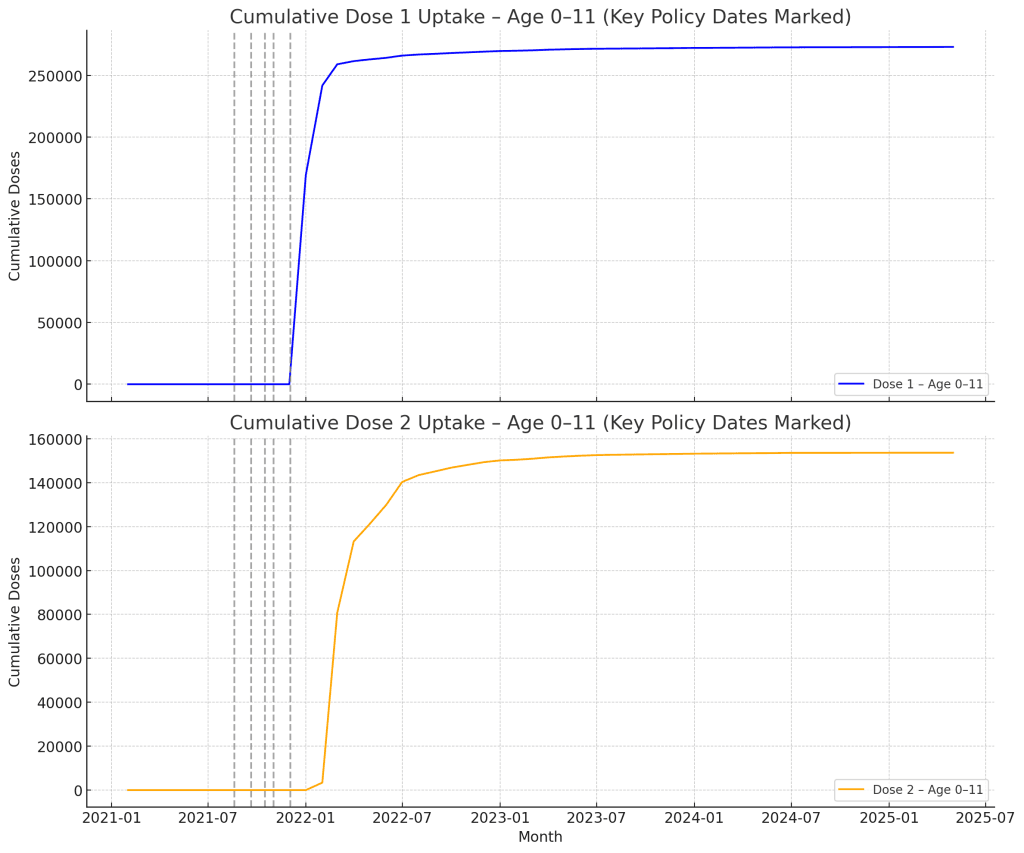
For children, eligibility didn’t begin until January 2022, well after the mandate-driven messaging had peaked. Unsurprisingly:
- Dose 1 uptake was modest, rising through early 2022, but quickly plateaued.
- Dose 2 never reached the same levels, indicating many parents opted out of completing the course.
There was no sign of policy-linked inflection points in these curves — no Super Saturday spike, no summer surge — because the campaign pressure that existed for adults wasn’t replicated here.
🎯 What This Tells Us
Vaccination uptake wasn’t just about eligibility. It was also about incentives, restrictions, and timing. The data makes that clear:
- When participation was tied to access to work, school, or social life, uptake spiked.
- When those pressures faded, so did the momentum — especially among younger age groups.
These curves don’t show intent or belief — they show behavior in response to policy. And now that we finally have access to the real rollout data, the patterns are unmistakable.