


A recent release from Japan showing the deaths by doses taken vs deaths of the unvaccinated made me curious to see if we had the data to reproduce it.
Turns out, we do! From the original OIA that was (suspiciously) released just after Barry’s data theft his the news, we can plot all-cause mortality in NZ from early 2019-late 2023.
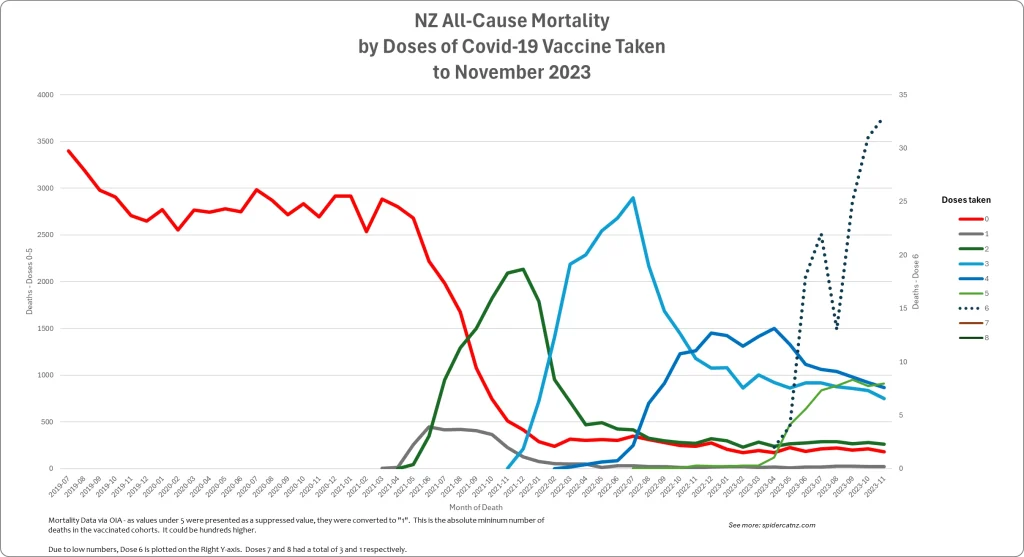
All Deaths – By Dose Count
And this is the per-capita rate:
Rate of Deaths per-100,000 People by Dose Count
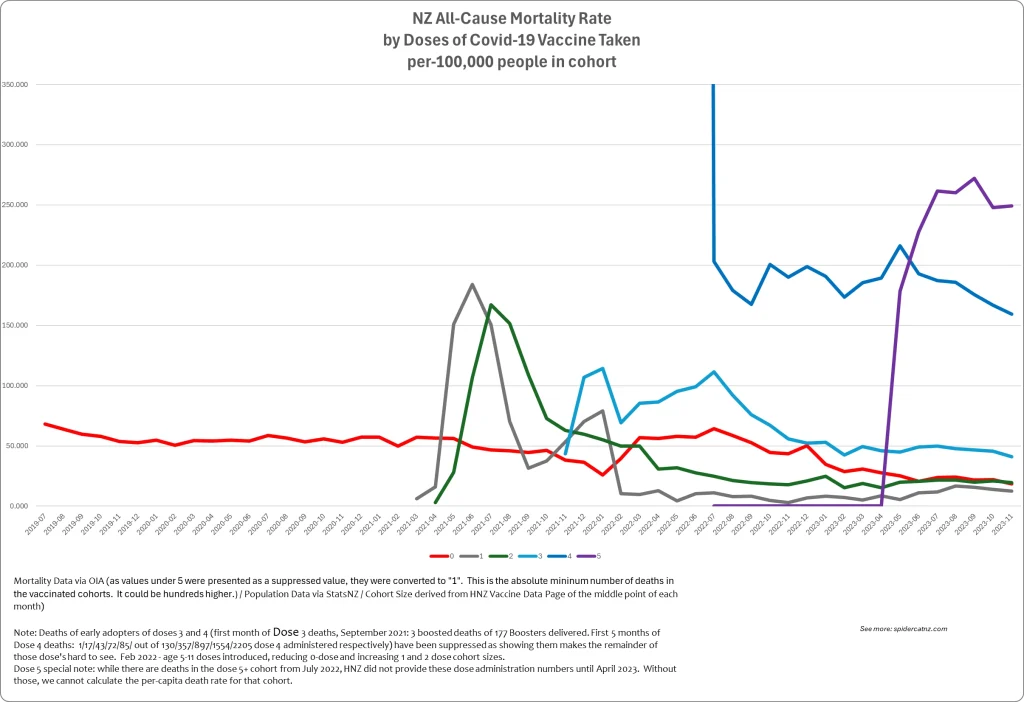
The tiny writing at the bottom says:
Mortality Data via OIA (as values under 5 were presented as a suppressed value, they were converted to “1”. This is the absolute mininum number of deaths in the vaccinated cohorts. It could be hundreds higher.) / Population Data via StatsNZ / Cohort Size derived from HNZ Vaccine Data Page of the middle point of each month)
Note: Deaths of early adopters of doses 3 and 4 (first month of Dose 3 deaths, September 2021: 3 boosted deaths of 177 Boosters delivered. First 5 months of Dose 4 deaths: 1/17/43/72/85/ out of 130/357/897/1554/2205 dose 4 administered respectively) have been suppressed as showing them makes the remainder of those dose’s hard to see. Feb 2022 – age 5-11 doses introduced, reducing 0-dose and increasing 1 and 2 dose cohort sizes.
Dose 5 special note: while there are deaths in the dose 5+ cohort from July 2022, HNZ did not provide these dose administration numbers until April 2023. Without those, we cannot calculate the per-capita death rate for that cohort.
As you can see, the 0-dose cohort ends up with a relatively low death rate, lower even than it was through 2019.
This data is all deaths, with no age-stratification of dose types available, so no age-stratification has been done.. yet.