


Official figures from the Ministry of Justice show that New Zealand’s violent offending—encompassing murder, assault, sexual violence, robbery, and related offences—is dominated by male offenders and exhibits pronounced disparities when viewed by ethnicity.
Most Offenders Are Male
In 2024, men comprised 84% of all people charged and 86% of all people convicted of violent offences. Women made up just 16% of charged offenders and 14% of those convicted.
Sex Breakdown, People Convicted of Violent Offences (2024)
- Male: 8,898 (86%)
- Female: 1,416 (14%)
- Unknown: 1 (<1%)
A note on the “unknown” sex stat:
In the justice statistics provided by the New Zealand Ministry of Justice, the term “unknown” for sex typically refers to instances where an individual’s sex was not recorded, not specified, or could not be determined at the time of data collection. This category ensures that all cases are accounted for, even when complete demographic information is unavailable.
While the Ministry of Justice does not explicitly define “unknown” sex in their publicly available documentation, related agencies like the Department of Corrections provide some context. The Department of Corrections records four gender categories: Male, Female, Unknown, and Indeterminate. In some reports, the “Unknown” and “Indeterminate” categories are amalgamated or omitted from display when their numbers are insignificant
For precise definitions or further clarification, you may consider reaching out directly to the Ministry of Justice via their contact page: https://www.justice.govt.nz/about/contact-us/.
Observations
- Declining Trend: Both male and female incarceration rates have generally declined over the decade, with male rates decreasing from approximately 419.1 to 334.2 per 100,000, and female rates from 69.5 to 52.6 per 100,000.
- Gender Disparity: Male incarceration rates consistently remain significantly higher than female rates throughout the period.
Note: Population figures are approximate and based on available data from Stats NZ.
This male majority was stable over the past decade and applies to all violent offence types.
Ethnic Patterns Strong and Persistent
When the number of people charged or convicted is compared against population size (2023 Census), there are notable ethnic disparities.
Ethnic Breakdown—Convictions in 2024
- Māori: 5,801 convictions (56%)
- European: 3,094 (30%)
- Pacific Peoples: 1,310 (13%)
- Asian: 280 (3%)
- Other/Unknown: 516 (5%)
Population Shares—2023 Census (rounded; people can identify with multiple groups)
- Māori: ~17% of total population (978,000)
- European: ~70% (3,528,000)
- Pacific Peoples: ~9% (444,000)
- Asian: ~18% (924,000)
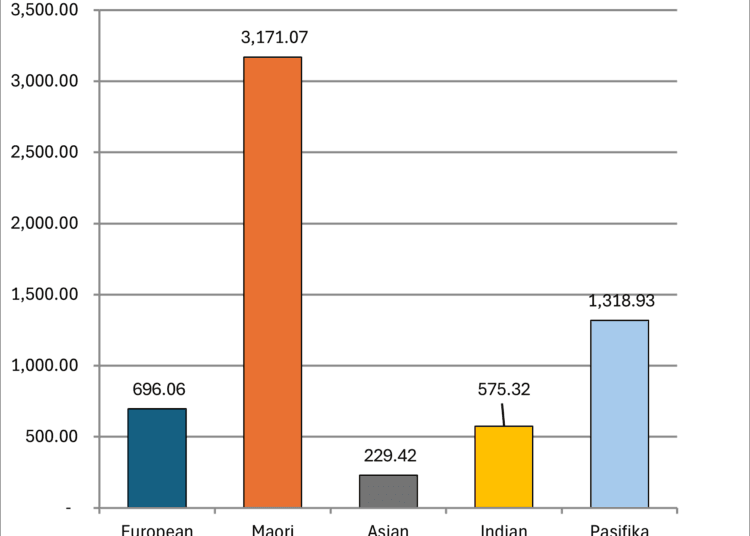
Per Capita Conviction Rates (per 100,000, 2024):
- Māori: 593 per 100,000 (5,801 / 978,000)
- Pacific Peoples: 295 per 100,000 (1,310 / 444,000)
- European: 88 per 100,000 (3,094 / 3,528,000)
- Asian: 30 per 100,000 (280 / 924,000)
Put simply, Māori are over six times more likely and Pacific people more than three times more likely than Europeans to be convicted of violent offences in New Zealand. Asian New Zealanders had the lowest rates in all years reviewed. These patterns also appear among people charged, not just convicted.
Age Trends
The most common ages for violent offending are 20-34:


- Ages 20-24: 15% of convictions
- Ages 25-34: 37% of convictions
There is a clear drop-off after age 40.
Victim Data
Detailed victim demographic data is not included in these Justice tables, though data on sexual offending (in separate workbooks) shows the majority of victims are female or children. For non-sexual violent offending, previous Ministry of Justice releases have consistently recorded that males are also more likely to be victims of violence overall, except for certain crime types.
Police data appears to show that Females report Victimisation of violent crime more than Males until around age 30, at which point the ratios reverse (35-39 is a slight outlier), with more men than women reporting victimisation of violent crime. There is a MASSIVE amount of Unspecified in there though. Take it with a grain of salt.

Offender-Victim Relationships
NZ data does not break down violent offending by the relationship between the victim and offender, nor by matched ethnicity or gender. However, the persistent overrepresentation of some demographics as offenders, and the general pattern of younger females being most at risk of victimization, aligns with some international criminological findings.
Stability of Trends
Year-on-year, the ethnic and sex shares of both charges and convictions have remained stable. Since 2015, Māori have accounted for about half or more of all people charged or convicted of violence.
Sentencing
31% of convicted violent offenders received an imprisonment sentence in 2024. The most common other sentences included home detention, community detention, intensive supervision, and community work.
Analysis Caveats
- Many people report multiple ethnicities; thus, summed ethnic counts may exceed the number of unique offenders.
- “Unknown” ethnicity and age is rising, as is common in administrative data.
- These figures reflect those caught and prosecuted in the criminal justice system.
Summary
Violent offending in New Zealand is committed predominantly by young men, with Māori and Pacific offenders being significantly overrepresented relative to their share of the national population, and Europeans and Asians underrepresented. These trends have been consistent for many years. The majority of violent crime convictions do not result in imprisonment.
Sources:
- Ministry of Justice, “Violent offences – Number and Percentage of People with Finalised Charges and Convictions by Gender, Ethnicity, and Age Group, 2015–2024”
- Stats NZ, “2023 Census Population Counts by Ethnicity” (Multi-ethnic identification means totals by ethnicity exceed national totals.)
1. Overall Totals
| Charges | Convictions | Conviction Rate | |
|---|---|---|---|
| Violent offences (total) | 34,971 | 18,807 | 54% |
- In 2024, 54% of violent offence charges resulted in conviction.
Note: “Violent offences” in this data includes murder, attempted murder, manslaughter, acts intended to cause injury, sexual assault and related offences, abduction, kidnapping, deprivation of liberty, and robbery. The dataset does not separate all sub-types in one table, so this uses “violent offences” as the unit for both overall and conviction tables.
| Year | Male Convicted | Male Population | Male Rate per 100,000 | Female Convicted | Female Population | Female Rate per 100,000 |
|---|---|---|---|---|---|---|
| 2015 | 9,640 | 2,300,000 | 419.1 | 1,667 | 2,400,000 | 69.5 |
| 2016 | 10,320 | 2,320,000 | 444.8 | 1,703 | 2,420,000 | 70.4 |
| 2017 | 10,506 | 2,340,000 | 448.9 | 1,739 | 2,440,000 | 71.2 |
| 2018 | 9,989 | 2,360,000 | 423.7 | 1,575 | 2,460,000 | 64.0 |
| 2019 | 9,248 | 2,380,000 | 388.6 | 1,495 | 2,480,000 | 60.2 |
| 2020 | 9,305 | 2,400,000 | 387.7 | 1,364 | 2,500,000 | 54.6 |
| 2021 | 8,001 | 2,420,000 | 330.6 | 1,229 | 2,520,000 | 48.8 |
| 2022 | 8,198 | 2,440,000 | 335.8 | 1,217 | 2,540,000 | 47.9 |
| 2023 | 8,649 | 2,660,000 | 325.2 | 1,294 | 2,690,000 | 48.1 |
| 2024 | 8,898 | 2,663,300 | 334.2 | 1,416 | 2,693,400 | 52.6 |
2. Charges vs Convictions by Sex
Charges by Sex (2024):
| Sex | Charges | % of Charges |
|---|---|---|
| Male | 13,752 | 84% |
| Female | 2,606 | 16% |
| Unknown | 6 | <1% |
| Total | 16,364 | 100% |
Convictions by Sex (2024):
| Sex | Convictions | % of Convictions |
|---|---|---|
| Male | 8,898 | 86% |
| Female | 1,416 | 14% |
| Unknown | 1 | <1% |
| Total | 10,315 | 100% |
Conviction Rate by Sex (2024):
| Sex | Conviction Rate (%) |
|---|---|
| Male | 65% (8,898/13,752) |
| Female | 54% (1,416/2,606) |
| Unknown | 17% (1/6) |
3. Charges vs Convictions by Ethnicity
Charges by Ethnicity (2024):
| Ethnicity | Charges | % of Charges |
|---|---|---|
| Māori | 8,414 | 51% |
| European | 4,968 | 30% |
| Pacific People | 2,021 | 12% |
| Asian | 604 | 4% |
| Other | 295 | 2% |
| Unknown | 1,004 | 6% |
| Total | 16,364 | 100% |
Convictions by Ethnicity (2024):
| Ethnicity | Convictions | % of Convictions |
|---|---|---|
| Māori | 5,801 | 56% |
| European | 3,094 | 30% |
| Pacific People | 1,310 | 13% |
| Asian | 280 | 3% |
| Other | 169 | 2% |
| Unknown | 347 | 3% |
| Total | 10,315 | 100% |
Conviction Rate by Ethnicity (2024):
| Ethnicity | Conviction Rate (%) |
|---|---|
| Māori | 69% (5,801 / 8,414) |
| European | 62% (3,094 / 4,968) |
| Pacific People | 65% (1,310 / 2,021) |
| Asian | 46% (280 / 604) |
| Other | 57% (169 / 295) |
| Unknown | 35% (347 / 1,004) |
4. Key Points and Trends
- Overall, just over half of all violent charges lead to conviction (54%).
- Males are both charged and convicted at higher rates than females.
- Māori account for the majority of both charges and convictions (around 51% and 56%, respectively), and have the highest conviction rate among main ethnic groups.
- Pacific Peoples also have a high conviction rate.
- Europeans represent about 30% of both charges and convictions, with conviction rates somewhat lower than Māori and Pacific groups.
- Asians have both low raw numbers and the lowest conviction rate by ethnicity.
- “Unknown” ethnicity has a notably lower conviction rate, possibly due to incomplete records.
Summary Table: Charges and Convictions (2024)
| Category | Charges | % Charges | Convictions | % Convictions | Conviction Rate |
|---|---|---|---|---|---|
| Total | 16,364 | 100% | 10,315 | 100% | 63% |
| Male | 13,752 | 84% | 8,898 | 86% | 65% |
| Female | 2,606 | 16% | 1,416 | 14% | 54% |
| Māori | 8,414 | 51% | 5,801 | 56% | 69% |
| European | 4,968 | 30% | 3,094 | 30% | 62% |
| Pacific | 2,021 | 12% | 1,310 | 13% | 65% |
| Asian | 604 | 4% | 280 | 3% | 46% |
| Other | 295 | 2% | 169 | 2% | 57% |
| Unknown | 1,004 | 6% | 347 | 3% | 35% |
Source: Ministry of Justice, Tables 1b, 2b, 3b, 2024. Table compiled and calculated for clarity.