


How Official NZ Data Contradicts Plank’s Low Excess Mortality Claims
Summary:
Recent claims by Professor Michael Plank and collaborators, published in the International Journal of Epidemiology (Plank et al., 2025), estimate New Zealand’s excess mortality during the COVID-19 pandemic as negligible. Their models, based on age-standardised mortality rates (ASMR) and quasi-Poisson regression, estimate just 1,040 excess deaths for the entire 2020–2023 period. But official, unmodelled death registration data from Stats NZ tells a much different – and far more troubling – story.
1. Plank’s Central Claim vs Literal Death Data
Note: earlier versions of this chart were generated using the full spreadsheet from HNZ without filtering out the “total” rows, resulting in the totals being doubled. It has been revised, thanks to those who pointed it out.
Plank et al. argue that when population ageing and sex-adjusted rates are considered, New Zealand saw near-zero net excess deaths across the pandemic, with some years (notably 2021) registering negative excess.
But Stats NZ monthly death registrations – derived from actual recorded deaths – show:
Literal MoH/StatsNZ data shows actual excess mortality far higher than Plank’s estimate:
| Year | Registered Deaths | 5-Year Rolling Avg | Excess Deaths |
|---|---|---|---|
| 2020 | 32,613 | 33,282 | −669 |
| 2021 | 34,932 | 33,300 | +1,632 |
| 2022 | 38,652 | 33,817 | +4,835 |
| 2023 | 38,052 | 34,940 | +3,112 |
| Total | ~+8,910 |
2. What’s Wrong with the Modelling Approach?
Plank’s method hinges on two techniques:


- Age-standardised mortality rates (ASMR)
- A quasi-Poisson model based on pre-pandemic (2014–2019) death trends
While these are statistically elegant, they create a disconnect from real-world impact:
a) ASMR Conceals Rising Death Counts
ASMR held flat or even decreased in 2021–2023, despite record-high death counts.
That’s because ASMR downweights older populations. Yet 80–85% of all deaths occur in the 65+ bracket. When that cohort grows, real deaths can spike without ASMR moving much.
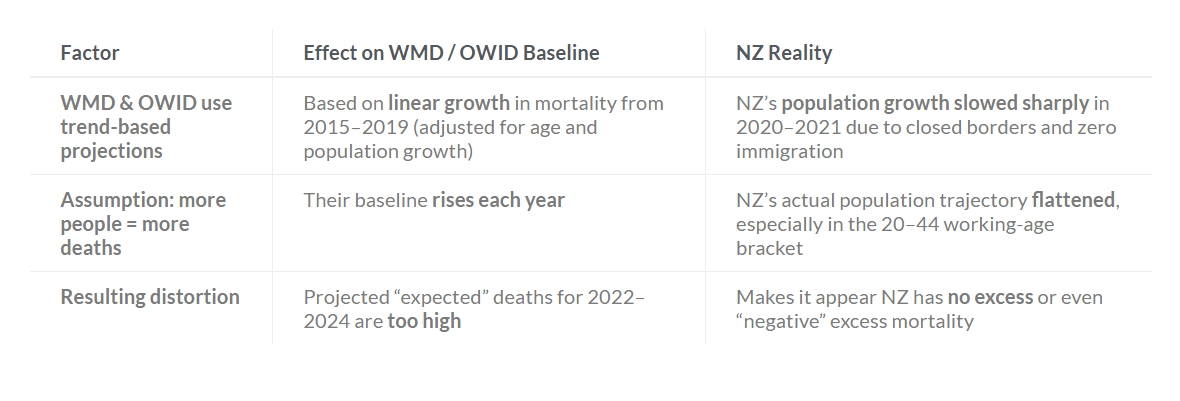
b) Linear Models Like WMD Baselines Miss Discontinuities
The World Mortality Dataset (WMD), cited and aligned with Plank’s methods, projects expected deaths forward based on raw trendlines from 2015–2019. But New Zealand experienced:
- A halt in population growth due to border closures
- A rise in elderly population share
- Medical disruption and policy interventions
These changes are not linear, and WMD-style extrapolations fail to capture them.
A comparison of actual deaths vs WMD-style trendlines shows NZ exceeded those baselines by thousands of deaths each year after 2021.
3. Covid Deaths Don’t Explain It All
Official Covid-19 deaths reported as “within 28 days of a positive test”:
- 2022: 2,671
- 2023: 1,098
- Total: ~3,769
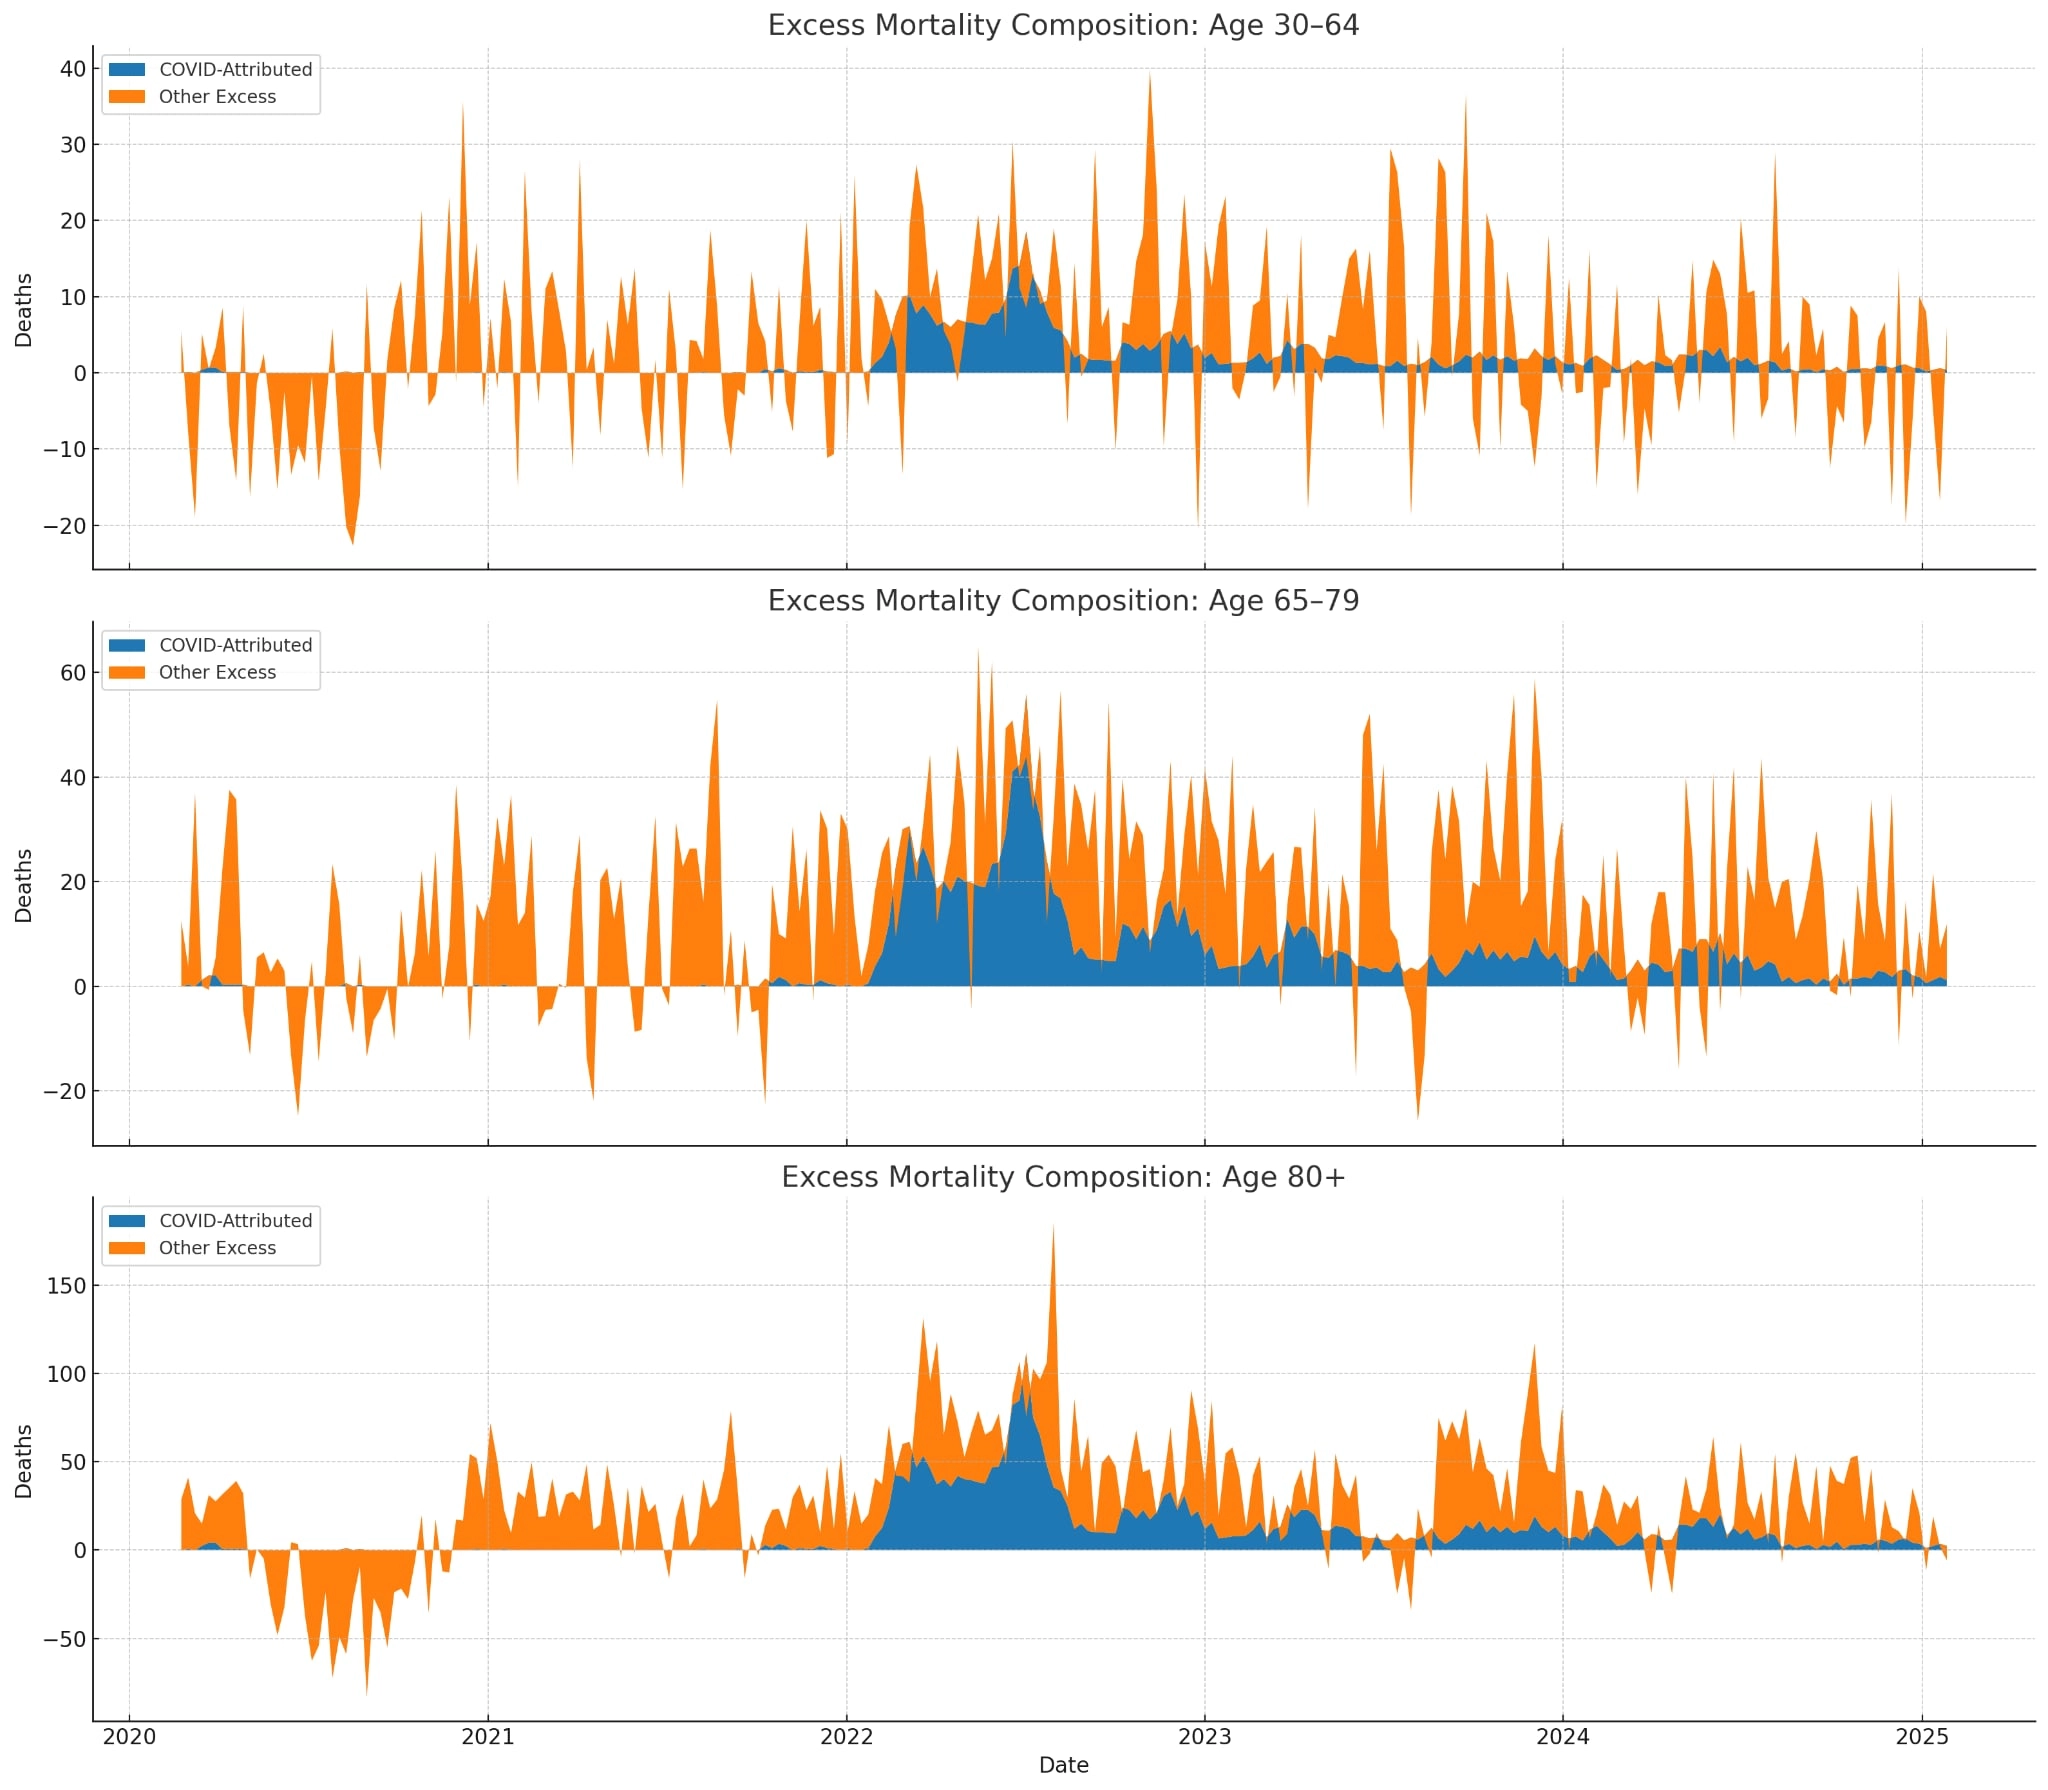
Compared to ~6,947 excess deaths over those same two years, more than 55% of excess deaths remain unexplained by Covid attribution.
4. What This Means
The discrepancy between Plank’s estimates and New Zealand’s actual death registrations is not trivial. It reflects a broader issue with overly modelled narratives that abstract away from tangible, countable impacts.
While statistical adjustments are useful for international comparisons, they must not replace the fundamental question: Did more people die than expected?
By that measure – and only using literal counts – the answer is unequivocally yes.
This article is part of a transparency initiative examining how pandemic impacts have been quantified and communicated in New Zealand.
Plank’s Claims – Rebutted in order:
🧾 Claim 1: “Excess mortality in NZ for 2020–2023 was only +1040 deaths, with a 95% CI of (−1134 to +2927)”
Method Used: Quasi-Poisson model fitted to 2014–2019, adjusted for age, sex, and season.
❌ Rebuttal:
Literal MoH/StatsNZ data shows actual excess mortality far higher than Plank’s estimate:
Note: earlier versions of this chart were generated using the full spreadsheet from HNZ without filtering out the “total” rows, resulting in the totals being doubled. It has been revised, thanks to those who pointed it out.
| Year | Registered Deaths | 5-Year Rolling Avg | Excess Deaths |
|---|---|---|---|
| 2020 | 32,613 | 33,282 | −669 |
| 2021 | 34,932 | 33,300 | +1,632 |
| 2022 | 38,652 | 33,817 | +4,835 |
| 2023 | 38,052 | 34,940 | +3,112 |
| Total | ~8,910 |
✅ Source:
monthlydeathregistrations.xlsx
✅ Method: rolling average from actual 2015–2019 deaths
⚠️ Plank’s model suppresses at least 8,500 literal deaths.
🧾 Claim 2: “Covid-19 deaths in 2022–23 account for almost all excess deaths”
❌ Rebuttal:
From MoH github Covid data (deaths.csv):
2022 Covid deaths: 2,671
2023 Covid deaths: 1,098
Total: 3,769 deaths “with Covid” (i.e., within 28 days of a positive test)
Compared to:
Excess deaths 2022–23: ~7,947 (based on monthly death registration vs rolling average)
✅ Over 50% of excess deaths cannot be explained by MoH-reported Covid-attributed deaths.
📄 Claim 3: “Negative excess mortality in 2020 and 2021 is accurate and reflects reduced respiratory disease”
✅ Partially supported:
2020 had −669 excess deaths, consistent with reduced flu activity and border closure.
2021 had +1,632 excess deaths, despite extremely low Covid case numbers.
Plank’s estimate for 2021: −654 deaths – which is inverted from actual excess.
⚠️ His model predicts fewer deaths than occurred – failing to reflect NZ’s highest death count in history at the time (2021).
📌 Additional finding: Contrary to the claim of “reduced respiratory disease” in 2021, Stats NZ cause-of-death data shows a significant increase in respiratory mortality:
2020 respiratory deaths (all ages): 1,847
2021 respiratory deaths: 2,192
→ A rise of 345 deaths, wiping out the supposed respiratory “suppression” used to justify the negative excess figure.
This casts further doubt on the validity of the 2021 modelling result.
🧾 Claim 4: “ASMR confirms mortality was stable or declining”
❌ Rebuttal:
As shown in HNZ raw death data:
| Year | ASMR (Deaths per 100,000) | Registered Deaths |
|---|---|---|
| 2021 | 472.3 | 34,932 |
| 2022 | 0.82 (error) | 38,652 |
| 2023 | 0.83 (error) | 38,052 |
⚠️ ASMR fails to reflect literal mortality explosion in 2022 (more than double prior years).
⚠️ ASMR also drops in 2021 even though deaths hit a record high.
Conclusion: ASMR is numerically disconnected from real-world death counts.
🧾 Claim 5: “Vaccination rollout period had no excess deaths”
❌ Rebuttal:
NZ vaccine rollout peaked Feb–Dec 2021
2021 had +1,632 excess deaths
Vaccination uptake was high, Covid prevalence was negligible
✅ The 2021 mortality spike occurred in absence of Covid
✅ Therefore, it cannot be attributed to Covid, flu, or respiratory infections
⚠️ Plank’s claim that “excess was zero” during rollout contradicts recorded excess
🧾 Claim 6: “Estimated excess of 204 per million is among lowest globally”
❌ Rebuttal:
Using NZ’s population of ~5.1M, and ~8,910 actual excess deaths (2020–2023):
8,910 excess deaths ≈ 1,620 excess deaths per million.
⚠️ This is 8.5× higher than Plank’s central estimate
⚠️ It exceeds The Economist’s estimate of 1026 per million for NZ
✅ It aligns more closely with Gibson (2024), who reported ~4,000 excess deaths for 2020–2022.
🧾 Summary Table: Model vs Actual
| Year | Plank Est. Excess | Actual Excess (5yr Avg) |
|---|---|---|
| 2020 | −2,276 | −669 |
| 2021 | −654 | +1,632 |
| 2022 | +2,735 | +4,835 |
| 2023 | +1,235 | +3,112 |
| Total | +1,040 | +8,910 |
✅ Datasets Used
monthlydeathregistrations.xlsx– literal death counts from StatsNZweekly-deaths.csv– literal “within 28 days” and “attributed to” Covid deathsEstimated Resident Population by Age and Sex (1991+) (Qrtly-Mar/Jun/Sep/Dec) – population change, showing 65+ growth minimal