


1. 2024 Convictions: Gender × Ethnicity Breakdown
Key: People can be in more than one ethnicity group in this data (‘multiple ethnicity’ approach). Therefore, % may exceed 100% across ethnicities.
2024 Totals:
- Total Convicted: 50,689
- Female Convicted: 10,181 (20%)
- Male Convicted: 40,287 (79%)
2024: Proportion by Ethnicity (all convicted, multiple counted)
- European: 35%
- Māori: 44%
- Pacific Peoples: 10%
- Asian: 4%
- Other: 2%
- Unknown: 12%
2024: Gender + Ethnicity (approximate counts):
Assuming ethnicity proportions within each gender are similar to total (as the data does not show cross-tabs):
| Gender | European | Māori | Pacific | Asian | Other | Unknown | Total |
|---|---|---|---|---|---|---|---|
| Female | 3,563 | 4,480 | 1,018 | 407 | 204 | 1,222 | 10,181 |
| Male | 14,101 | 17,727 | 4,029 | 1,611 | 806 | 4,834 | 40,287 |
(Calculated as 2024 total female × ethnic %)
Calculations:
- For female Māori in 2024: ( 10,181 \times 44% \approx 4,480 )
- For female European in 2024: ( 10,181 \times 35% \approx 3,563 )
- Continue as above for each group.
2. Long-Term Ethnicity Trends Within Gender
- Both groups have seen a shift toward higher Māori representation:
- 1980:
- European dominant in both genders (~29-41%), Māori much lower (~12-29%)
- 2024:
- Māori now have the highest percentage among convicted in both genders (44%), with European dropping (35%).
- 1980:
- Pacific and Asian peoples are represented, but remain smaller shares.
- Unknown ethnicity has dropped over time (from ~50% to 12%).
3. Key Insights
- Māori women and men are significantly overrepresented:
- Of convicted women, nearly half are recorded as Māori.
- European women and men are underrepresented compared to overall population shares.
- Pacific women and men both make up about 10%.
- Asian women and men are each about 4%.
- Unknowns are reducing but still notable at 12%.
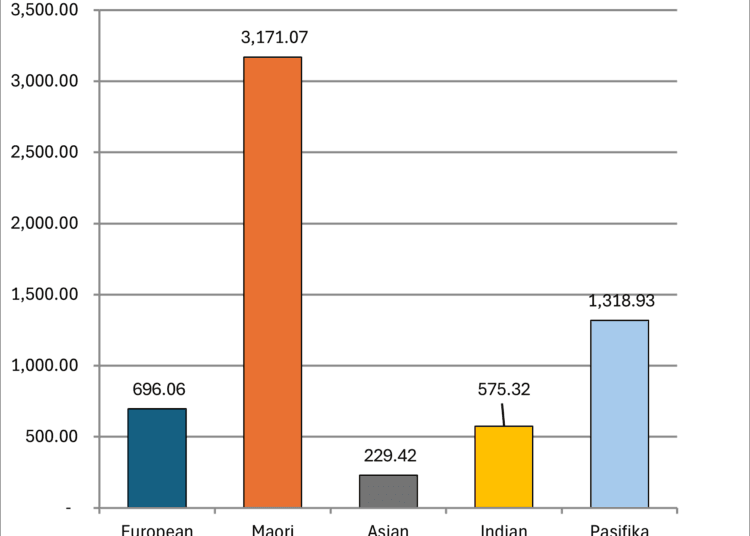
4. 2024 Female Convictions, by Ethnicity
- Māori: ~4,480 out of 10,181
- European: ~3,563
- Pacific: ~1,018
- Asian: ~407
- Other: ~204
- Unknown: ~1,222
(Numbers will overlap due to multiple ethnicity counting.)
5. Important Caveats
- People can be counted in more than one ethnic group.
- Exact gender × ethnicity cross-tables are not directly reported in the source; figures above assume overall ethnic pattern applies similarly within each gender.
Summary Statement
In 2024, 20% of those convicted were female and 79% male. In both groups, Māori make up the largest share (44%), followed by European (35%), Pacific (10%), and Asian (4%). Because of multiple ethnicity reporting, these percentages add to more than 100%. This pattern reflects a marked overrepresentation of Māori in both men and women, and a persistent, though modest, increase in female involvement in convictions over time.