


Over the past decade, data on finalized charges for sexual offenses in New Zealand reveals striking patterns regarding the sex and ethnicity of offenders, as well as their relationship to the victim profile. This analysis draws from justice statistics spanning 2015–2024, providing a factual breakdown of who is being charged and against whom.
Sex of Offenders: A Stark Imbalance
The sex disparity among those charged with sexual offences in New Zealand remains pronounced and consistent. In 2024, men accounted for 98% (1,681 out of 1,719) of those with finalised charges for sexual offences, a percentage that has stayed virtually unchanged since 2015. Female offenders comprised just 2% (36 people) of total cases in 2024.
This trend persists across all victim types:
- Against children under 16: 98% of offenders charged were male in 2024.
- Against adult females: 98% male offenders in 2024.
- Against adult males: 86% male offenders, with some small annual fluctuations due to low case numbers (5 out of 35 in 2024 were female).
Even within more specific offence categories, such as sexual violation or objectionable publication, the vast majority of offenders were male, consistently accounting for 95–99% of those charged.
Population Overview
According to the 2023 Census, New Zealand’s population was 4,993,923. The “gender composition” was:


- Male: 2,446,922 (49%)
- Female: 2,496,961 (50%)
- Other Genders: 49,040 (1%)
Note: The “Other Genders” category includes individuals who identify outside the traditional male and female binary.
Sex of Offenders
In 2024, 1,719 individuals have finalized charges for sexual offenses:
- Male: 1,681 (98%)
- Female: 36 (2%)
- Unknown: 2 (<1%)
Per-Capita Analysis by Sex
To understand the prevalence of charges within each sex group, we calculate the per-capita rates per 100,000 people:
- Male: (1,681 / 2,446,922) * 100,000 ≈ 68.7
- Female: (36 / 2,496,961) * 100,000 ≈ 1.4
- Unknown Sex: (2 / 49,040) * 100,000 ≈ 4.1
Interpretation
The per-capita analysis reveals:
- Males: 68.7 per 100,000
- Females: 1.4 per 100,000
- Other Genders: 4.1 per 100,000
These figures show that, relative to their population sizes, males have a significantly higher rate of individuals charged with sexual offenses compared to females and “other genders.” The “other genders” have a sexual offending rate approximately three times that of females.
Ethnicity Breakdown of Offenders
Population Overview
According to the 2023 Census, New Zealand’s “usually resident population” was 4,993,923. The ethnic composition was as follows:
- European: 3,383,742 (67.8%)
- Māori: 887,493 (17.8%)
- Asian: 861,576 (17.3%)
- Pacific Peoples: 442,632 (8.9%)
- Middle Eastern/Latin American/African (MELAA): 92,760 (1.9%)
- Other Ethnicities: 56,133 (1.1%)
Note: Individuals could identify with multiple ethnicities; thus, percentages exceed 100%.
Ethnicity of Offenders
The ethnic distribution of offenders in 2024 was:
- European: 697 (39.1%)
- Māori: 485 (27.2%)
- Pacific Peoples: 201 (11.3%)
- Asian: 138 (7.7%)
- Other: 31 (2%)
- Unknown: 229 (12.8%)
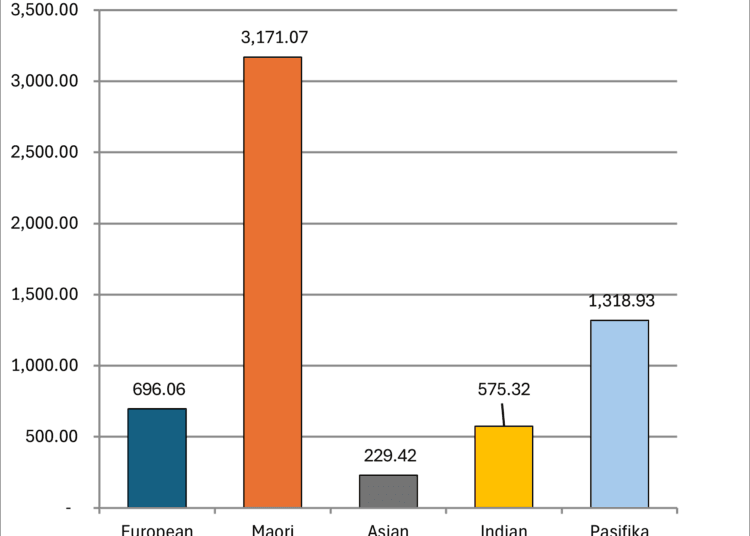
Per Capita Analysis by Ethnicity
To understand the prevalence of charges within each ethnic group, we calculate the per-capita rates per 100,000 individuals:
- European: (697 / 3,383,742) * 100,000 ≈ 20.6
- Māori: (485 / 887,493) * 100,000 ≈ 54.6
- Pacific Peoples: (201 / 442,632) * 100,000 ≈ 45.4
- Asian: (138 / 861,576) * 100,000 ≈ 16.0
- Other: (31 / 56,133) * 100,000 ≈ 55.2
Interpretation
The per-capita analysis reveals:
- Māori: Highest specified ethnic group rate at 54.6 per 100,000.
- Other Ethnicities: 55.2 per 100,000.
- Pacific Peoples: 45.4 per 100,000.
- European: 20.6 per 100,000.
- Asian: 16.0 per 100,000.
These figures suggest that, relative to their population sizes, Māori and Pacific Peoples have higher rates of individuals charged with sexual offenses compared to European and Asian groups.
Examining the ethnicity of people charged with sexual offences paints a nuanced picture:
- European ethnicity comprised the largest share but is trending downward: In 2024, Europeans made up 41% (697 out of 1,719) of people charged, down from 47% in 2015.
- Māori ethnicity consistently represents a significant portion, comprising 28% of offenders in 2024 (485 people). This proportion has remained relatively stable over the ten years, ranging from 28–34%.
- Pacific Peoples made up 12% in 2024 (201 people), while Asian offenders accounted for 8% (138 people).
- The category “Other” remained between 2–3%, while “Unknown” ethnicity has grown to 13% in 2024, up from 3% in 2015.
These ethnic patterns are reflected across different victim types. For example:
- For offences against children: 43% of offenders were European, 27% Māori, 12% Pacific Peoples, and 5% Asian in 2024.
- For offences against adult females: 36% were European, 31% Māori, 11% Pacific Peoples, and 12% Asian in 2024.
Victim-Offender Relationship By Demographics
Children (under 16 years old) are the most common victim group:
- In 2024, 58% of those charged with sexual offences had at least one child victim.
- Among these, the offender profile by ethnicity closely matches the overall pattern, with Europeans and Māori making up the majority.
Adult females (16 years and over) make up a significant subset:
- Men charged with offences against adult females made up 98% of the total in 2024.
- By ethnicity, in 2024, Europeans comprised 36%, Māori 31%, Pacific Peoples 11%, Asians 12%, and others or unknowns the remainder.
Adult males as victims present a slightly different profile:
- Offences against adult males (a much smaller group) still saw 86% of offenders as male. The ethnic breakdown fluctuated but aligns with overall trends: in 2024, 46% European, 26% Māori, smaller numbers for other groups due to the low total cases.
This general pattern is reflected in the conviction data for 2024:
- 40% of people convicted were European (365 out of 906 total convictions),
- 29% Māori (264),
- 13% Pacific Peoples (119),
- 8% Asian (75),
- 2% Other (16),
- 12% Unknown (106).
Additional Insights
- The age distribution of people with finalised charges is broad, but persons aged 19 or younger make up about 10% of those charged (2024: 170 out of 1,719).
- For all offence types (including rape, unlawful sexual connection, objectionable publication, and others), the male/female split, and the ethnic proportions, track closely to the overall numbers.
- The conviction rate for sexual offences remains close to 50% (46% in 2024).
Trends and Observations
The most consistent relationship is between male sex and offending, which is universal across all victim ages and sexes. Ethnic proportions gradually shift, notably with a slight decrease in the percentage of European offenders and a corresponding increase in unknown ethnicity—possibly reflecting changes in data collection or reporting.
There is no clear evidence from the data to suggest significant changes in who is committing sexual offenses by sex or ethnicity over the past decade. Male offenders, particularly those of European and Māori backgrounds, continue to be the most common profile across all victim groups.
Conclusion
The consistent findings of this analysis are the overwhelming predominance of males among sexual offenders and the shared representation of European and Māori ethnicities among those charged. These patterns are evident regardless of whether the victim is a child, an adult woman, or an adult man.
This data highlights the ongoing challenges faced by law enforcement and support agencies in New Zealand in working to reduce sexual offenses and address the underlying factors that contribute to offending—challenges that must respond to clear demographic realities without resorting to ideology.