


This is a topic that I have been following since early 2023, the one of Excess Mortality. I used the HSU spreadsheet that MoH once provided that showed the running totals over time of each dose group administered, and the OECD Mortality tool. It had the Excess Mortality baked in as a Column, so I didn’t even need to calculate it – just plot it against the Vaccine Rollout curve.
This had been available to everyone for some time. Straight from MoH and StatsNZ.
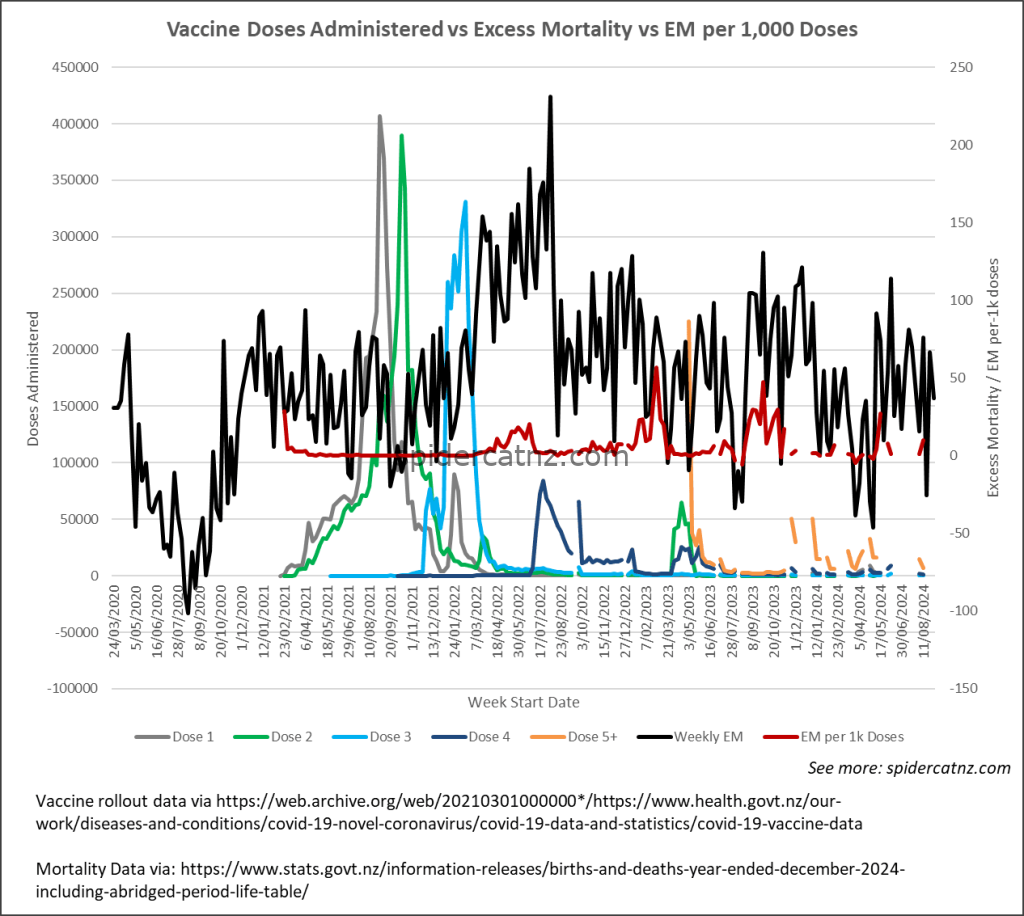
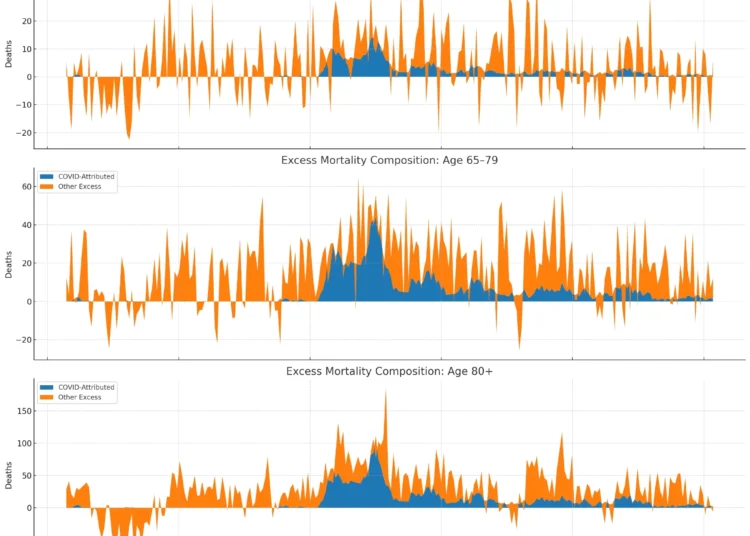
It sort of looked like there was a wave of vaccinations, then a wave of excess mortality which dipped a bit, then increased after dose 3, then dipped and increased again after dose 4.. maybe it was all just Covid. So I grabbed the deaths.csv from the MoH Github and plotted that against the Excess Mortality by age group. No. Lots of Excess Mortality before, and after Covid.
Back then, we had a weekly flow of data relating to vaccine group outcomes that took most of my interest. I’d take the raw numbers given by MoH each week from the Case Demographics (Doses 0/1/2/3+ for Cases, Hospitalisation and ICU, and 0/1, 2, 3+ and age group for deaths within 28 days of a test) and calculate the cohort sizes from the Vaccine Data page and Estimated Population from StatsNZ.. and then they cut it off. So I looked more at this.


Now we have the detailed monthly or provisional weekly datasets from StatsNZ, it’s easy to look at the mortality for NZ over time.
For Excess Mortality, we need to define what we are comparing it to. Our World in Data uses a fixed baseline of 2015-2019, the 5 years before Covid, so let’s use that, and the Monthly one because it’s not Provisional, and we’re not looking as granular as weekly for this basic exercise.
Open the Monthly-death-registrations-by-ethnicity-age-sex-Jan2010-Dec2024.xlsx file, go to the data tab, select all the data, and use it to make a pivot table.
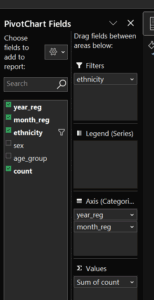
Filter by ehnicity – Total, Otherwise your mortality will count all the ethnicities and the total and it’s wrong.


You should have a chart that looks like that. We want the table that goes with it.
Longform, just to look at if any of the years in 2020 onwards were higher at this level: 2015 = 31,764. 2016 = 31,341. 2017 = 33,537. 2018 = 33,450. 2019 = 34,440. Total = 164,532 / 5 = 32,906.4.
2020 = 32,688. 2021 = 34,974. 2022 = 38,652. 2023 = 38,052. 2024 = 37,890.
Now, for the statement “New Zealand saw negative or negligible Excess Mortality compared to usual” to be true, each of those needs to be less than or equal to the average of 2015-2019 – 32,906; 2020 is. 2021 is over 2k more. 2022 is 5.3k more. 2024 is 4.8k more.
To go into the “Was it all Covid?” question, we need the deaths.csv from the moh github, compare it against the weekly or monthly. Maybe another time, but “did we have 12,000 or so Covid deaths?” could answer the question whether the 12k extra deaths were all Covid.
We’d had 4,483 covid deaths as at end December 2024, so no. It was not all Covid. There was something else making up the majority.
In case you are interested in WHY the modelers are wrong, they use the World Mortality Database, which uses linear-type projections of mortality based on historic mortality and population trends. Our population essentially stalled in 2020, which meant their models of those 12k deaths are based on a population that DID NOT stall due to lockdowns and a cessation of immigration.
| Factor | Effect on WMD / OWID Baseline | NZ Reality |
|---|---|---|
| WMD & OWID use trend-based projections | Based on linear growth in mortality from 2015–2019 (adjusted for age and population growth) | NZ’s population growth slowed sharply in 2020–2021 due to closed borders and zero immigration |
| Assumption: more people = more deaths | Their baseline rises each year | NZ’s actual population trajectory flattened, especially in the 20–44 working-age bracket |
| Resulting distortion | Projected “expected” deaths for 2022–2024 are too high | Makes it appear NZ has no excess or even “negative” excess mortality |