


In 2021, as New Zealand ramped up its COVID-19 vaccination campaign, headlines proclaimed striking successes: vaccination rates soaring past 90%, some districts claiming to have reached 100% coverage. But beneath the numbers lay a quieter, often overlooked distinction — one that may have shaped public perception and risk communication in profound ways.
That distinction? The population denominator.
The HSU: A Statistical Shortcut
Much of New Zealand’s official vaccine data — particularly the percentages cited in media releases and government dashboards — was based not on the total population, but on the Health Service User (HSU) population.
The HSU is a subset of the population: individuals who have interacted with the health system in recent years — by visiting a GP, filling a prescription, or being admitted to hospital. While efficient for logistical planning, the HSU figure systematically excludes those who haven’t engaged with the health system, including some young, healthy individuals, transient residents, and the under-documented.
In 2021, the total NZ population was estimated at around 5.1 million . The HSU population, by contrast, was closer to 4.3 million .
This difference — nearly 800,000 people — had a ripple effect on how vaccine coverage was reported.
When 90% Isn’t 90%
When the Ministry of Health or a local District Health Board claimed 90% of eligible people had received a first dose, they often meant 90% of the HSU population. Not of the whole population. In some regions, this led to paradoxical results — with coverage figures appearing to exceed 100%.


Take MidCentral DHB, which claimed 100% first dose coverage in late 2021. Social media users noted that vaccination clinics were still running and individuals were still receiving first doses. The confusion stemmed from the use of the HSU denominator — accurate from a database perspective, but misleading without context.
The 90% Project: Media Amplification vs Population Reality
In September 2021, the NZ Herald launched its ambitious “90% Project”, a public-facing media campaign encouraging 90% of eligible New Zealanders to be fully vaccinated against COVID-19 by Christmas. At the time, Ministry of Health figures reported that around 77% of the eligible population had received at least one dose, with approximately 45% fully vaccinated.
These figures were based on the Health Service User (HSU) population — a subset of the full population used in official reporting. Under that framing, only 23% of the HSU-defined eligible population remained unvaccinated in September 2021.
But when compared to New Zealand’s actual estimated total population of 5.1 million, the picture looked quite different. In reality, roughly 35% of New Zealanders had not yet received even a first dose.
By the time the 90% Project declared success in December 2021, reporting celebrated the achievement of 90% full vaccination coverage among the eligible population — again, based on the HSU denominator. This translated to just 10% unvaccinated in that framing.
However, under a total population model, that same milestone still left an estimated 24% of New Zealanders without a first dose.
Despite this disparity, the campaign was effective in driving uptake and public awareness. The initiative included mass media coverage, front-page editorials, and visual milestones such as illuminating Auckland’s Sky Tower with pro-vaccination messages like “We’re at the pointy end” and “It’s within arm’s reach.”
The NZ Herald’s 90% Project became a powerful example of how media, metrics, and messaging can converge — and how the choice of denominator can subtly shape the narrative of public health success.
Per-Capita Outcomes: A Different Picture
This population distinction becomes even more consequential when evaluating health outcomes: hospitalisations, ICU admissions, and deaths. In 2021, officials often described the unvaccinated as far more likely to experience severe outcomes — a pattern broadly supported by data. But how those risks were calculated depended heavily on group size.
Our analysis matched vaccine rollout data to COVID-19 hospitalisation and ICU outcome data throughout 2021. From this, we calculated per-capita risk rates for each vaccine group (0 doses, 1 dose, 2 doses), using both HSU and total population baselines.
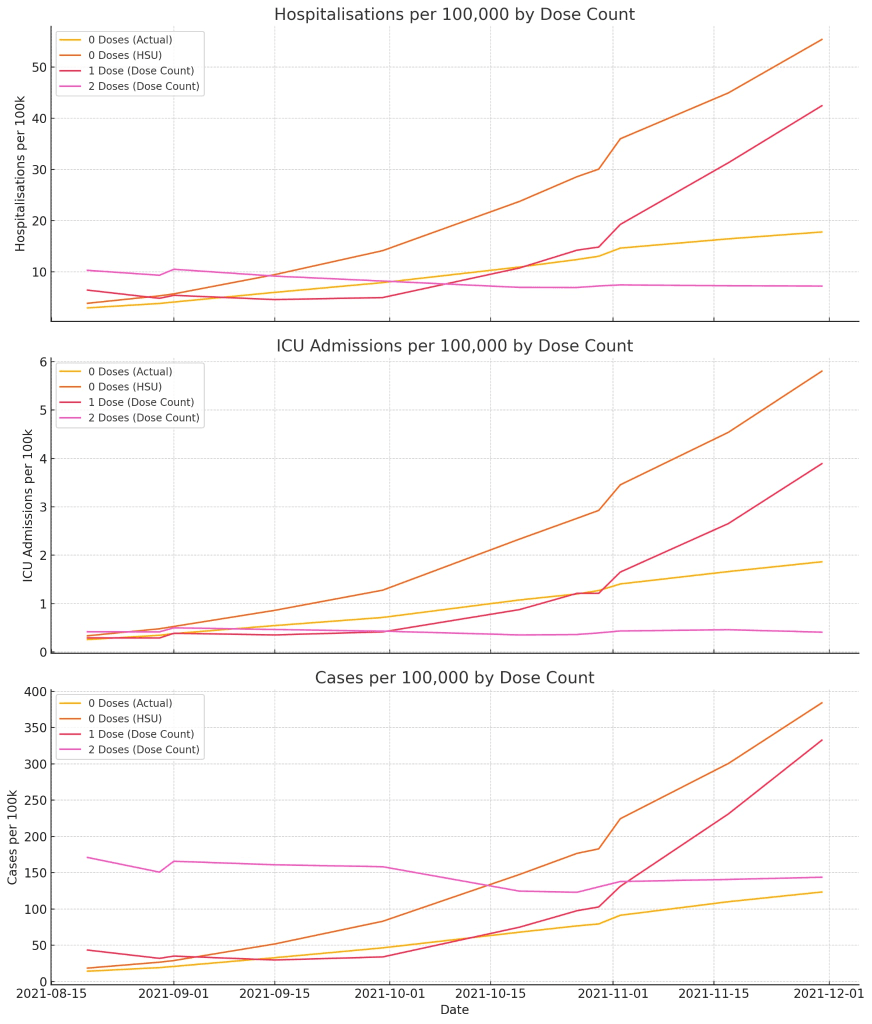
Key Findings:
- For 1-dose and 2-dose groups, the population size is defined by the number of doses administered. There’s no ambiguity here — the denominators are fixed.
- But for the 0-dose (unvaccinated) group, the population size differs dramatically depending on the denominator used:
- Using the HSU population, the unvaccinated group is smaller, and per-capita hospitalisations and ICU admissions appear much higher.
- Using the actual NZ population, the unvaccinated group is larger — and the per-capita risks drop accordingly.
The choice of denominator can amplify or mute how dangerous being unvaccinated appears in official data.
Why It Matters
In October 2021, Prime Minister Jacinda Ardern made a widely circulated statement:
“We still entirely expect that people who are vaccinated will still get Covid-19 – it just means they won’t get sick and they won’t die.”
— Jacinda Ardern, April 2021 – NZ Herald
At the time, this confident message was intended to build public trust in the vaccine’s protective benefits — particularly against severe illness and death. However, such an absolute statement is highly unusual in medical science. No vaccine or medication can offer a guarantee of zero illness or zero mortality. And while Ardern had access to expert advice, she herself holds no medical or epidemiological qualifications.
To date, no peer-reviewed statement from a licensed physician or immunologist appears to have made such a categorical claim about any COVID-19 vaccine.
What the Data Showed
Despite the reassurance, data from New Zealand in 2021 showed that vaccination reduced risk — but did not eliminate it.
- Over 4,200 vaccinated New Zealanders were hospitalised due to COVID-19 during 2021.
- 251 vaccinated individuals were admitted to intensive care.
These figures include people with one or two doses and reflect the reality that breakthrough infections can still lead to serious illness, albeit at lower rates than in the unvaccinated population.
From a behavioural standpoint, Ardern’s definitive phrasing likely served as a psychological nudge — a message engineered to motivate action by framing vaccination as a no-risk decision. Coming from the Prime Minister, such messaging carried institutional authority, potentially influencing hesitant individuals who might otherwise delay or decline vaccination.
But public trust in science relies not just on leadership, but on clarity and transparency.
The Contrast in Unvaccinated Outcomes
For comparison, here’s what the data show for unvaccinated individuals during the same period:
- Hospitalisations (Unvaccinated): ~112 people
- ICU admissions (Unvaccinated): ~11 people
These are raw event counts and remain the same regardless of the population baseline used.
However, the interpretation of those events changes depending on how large the unvaccinated group is assumed to be:
| Group | Hospitalisations / 100k | ICU Admissions / 100k |
|---|---|---|
| Vaccinated | 11.4 | 0.8 |
| Unvaccinated (HSU) | 23.4 | 2.3 |
| Unvaccinated (Actual) | 10.0 | 1.0 |
When using the HSU denominator, unvaccinated individuals appear more than twice as likely to require hospitalisation or ICU care compared to the vaccinated. But when using New Zealand’s actual estimated population, that difference largely disappears — and in the case of hospitalisation, vaccinated individuals actually had a slightly higher per-capita rate.
This highlights how the choice of denominator can strongly influence the narrative of risk, especially when communicated to the public through figures or statements from trusted authorities.
Vaccine Messaging, Psychology, and Public Trust
Alongside the data, the messaging from officials played a powerful role in shaping public attitudes toward the vaccine. From Ardern to health figures like Professor Michael Baker, Dr. Siouxsie Wiles, and Dr. Helen Petousis-Harris, public statements reinforced urgency and framed vaccination as both a personal and civic responsibility.
Notable phrases included:
- “We need to hunt down the unvaccinated.”
- “If you take the vaccine, you won’t get sick and you won’t die.”
- “We are literally finding the unvaccinated.”
- “The vaccine is your ticket to freedom.”
- “We have two classes of people: the vaccinated and the unvaccinated.”
These statements created what behavioural scientists call a “normative nudge” — a way of promoting desired behaviours by framing them as the social default.
But when paired with data framed using the smaller HSU denominator, they may have created a distorted picture: that nearly everyone was vaccinated, and the small remaining group was both rare and dangerously exposed.
A Call for Transparency
The use of the HSU population isn’t inherently misleading. It’s useful for operations, planning, and tracking uptake within known cohorts. But when used in public communication — especially without clarification — it risks conflating statistical convenience with absolute coverage.
As New Zealand and other countries continue to learn from the pandemic, this lesson stands out: how we define and present numbers matters. In public health, trust isn’t just earned through outcomes. It’s built — or lost — through transparency. And trust matters a lot.