


Covid
Analysis of official, public NZ Government Health Data relating to Covid.As of 24 February 2024, HNZ/TWO stopped providing Vaccination Status data for Cases/Hospital/ICU/Deaths with Covid.Unless otherwise specified, all data presented in this section is sourced from the NZ Government, with links to that source data provided.

How Many More Died Compared To Usual? – How to Calculate NZ’s ACTUAL Excess Mortality
This is a topic that I have been following since early 2023, the one of Excess Mortality. I used the...
Read moreDetails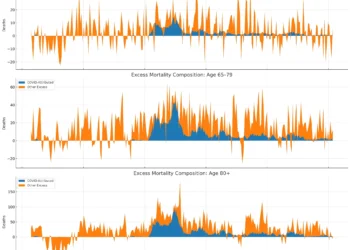
What the Data Shows – NZ’s Actual Excess Mortality
How Official NZ Data Contradicts Plank's Low Excess Mortality Claims Summary: Recent claims by Professor Michael Plank and collaborators, published...
Read moreDetails

Bradford Hill Criteria Assessment: COVID-19 Vaccine Dose and Mortality Data in New Zealand
This morning at the end of Lynda Wharton's amazing session at the Second Royal Commission of Inquiry into Covid Response...
Read moreDetails
We often hear “how many lives were saved”, how many Dollars were Saved (on pensions) in NZ over Covid?
Tonight, I noticed a post that specified how many billions of dollars Covid had saved the UK pension fund through...
Read moreDetails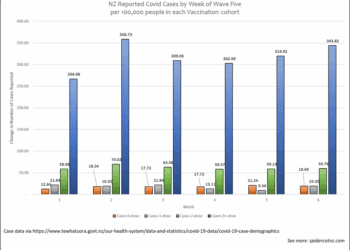
A look Back at NZ’s “Fifth Wave of Covid” by Vaccination Status
With the newly available doses by age group data, we can calculate the per-capita deaths with Covid by age group.
Read moreDetails
What Word is Missing From Recent Article on Reducing Infection to Avoid Long Covid in Children?
It's not there! It's always there!
Read moreDetails
What the Data Shows: Stolen vs Public Vaccine Data in New Zealand
The ongoing public debate over vaccine safety in New Zealand reached a fever pitch in late 2023 with the publication...
Read moreDetails
What the Public Data Shows: Deaths with Covid vs Deaths with Vaccine in New Zealand
Deaths with Covid vs Deaths within 29 days of vaccine dose in NZ - how do they compare?
Read moreDetails
What the Public Data Shows – Deaths within 30 days of Covid Vaccination in NZ
How many people died within 30 days of a Covid vaccine dose in NZ, and when?
Read moreDetails
NZ Covid Vaccine Rollout – by Age Group and Dose number – Feb 2021-May 2025
Who's got two fuzzy thumbs and the NZ Covid Vaccine rollout stratified by age-group? This cat. Look inside for how...
Read moreDetails
What the Data Shows: How Policy Nudged the Vaccine Uptake Curves
How did messaging and policy impact the uptake of Covid Vaccination in younger cohorts?
Read moreDetails
What the Public Data Shows – Vaccine Rollout vs Cases/Hospitalisations and Covid Deaths
Is there a relationship between doses and outcomes? In many cases, yes.
Read moreDetailsLatest Products
-
 SCNZ Car magnets
Price range: $7.00 through $9.00
SCNZ Car magnets
Price range: $7.00 through $9.00 -
 SCNZ 2025 Can cooler
$8.00
SCNZ 2025 Can cooler
$8.00 -
 SCNZ 2025 Gaming mouse pad
Price range: $25.00 through $43.00
SCNZ 2025 Gaming mouse pad
Price range: $25.00 through $43.00 -
 SCNZ Platinum Tier
$50.00
SCNZ Platinum Tier
$50.00 -
SCNZ Premium Tier
$10.00
“If they take the vaccine, they'll still get Covid, it just means they won't get sick and they won't die.”
— Jacinda Ardern
